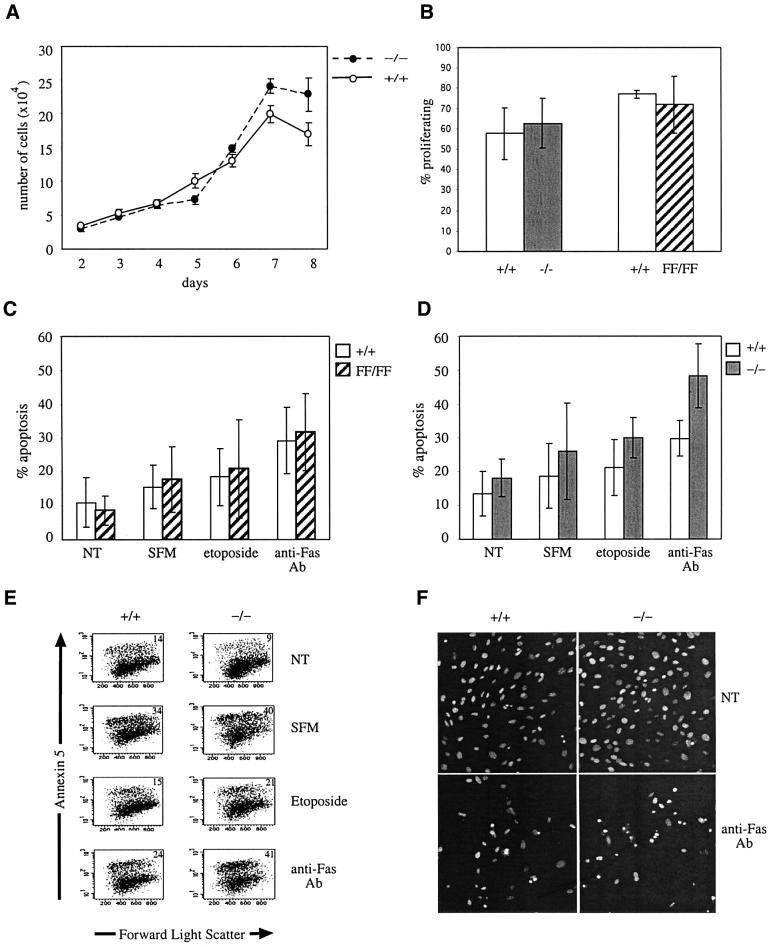
Fig. 3. Proliferation and apoptosis analysis of MEFs. (A) Growth curves of raf-1+/+ MEFs (open circles) compared with raf-1–/– MEFs (closed circles) over 8 days in culture are shown. (B) DNA synthesis of raf-1–/– and raf-1FF/FF primary MEFs compared with raf-1+/+ cells induced by 10% serum. The data represent pooled data from four experiments of cells with each genotype. (C and D) Levels of apoptosis in raf-1FF/FF cells compared with raf-1+/+ cells (C) and in raf-1–/– cells compared with raf-1+/+ cells (D). Cells were either not treated (NT) or treated with serum-free media (SFM), etoposide or anti-Fas antibody for 20 h. The percentage of cells undergoing apoptosis was quantified by flow cytometric analysis of annexin V staining. Each experiment was performed seven times and the data show mean values ± standard deviation. (E) An example of flow cytometric analysis of annexin V staining of cells for data presented in (C) and (D). The percentage of annexin V positive cells is indicated. (F) Hoechst 33258 staining of apoptotic cells. raf-1+/+ cells (left panels) and raf-1–/– cells (right panels) were either untreated (top panels) or treated with anti-Fas antibody (bottom panels).

An official website of the United States government
Here's how you know
Official websites use .gov
A
.gov website belongs to an official
government organization in the United States.
Secure .gov websites use HTTPS
A lock (
) or https:// means you've safely
connected to the .gov website. Share sensitive
information only on official, secure websites.
