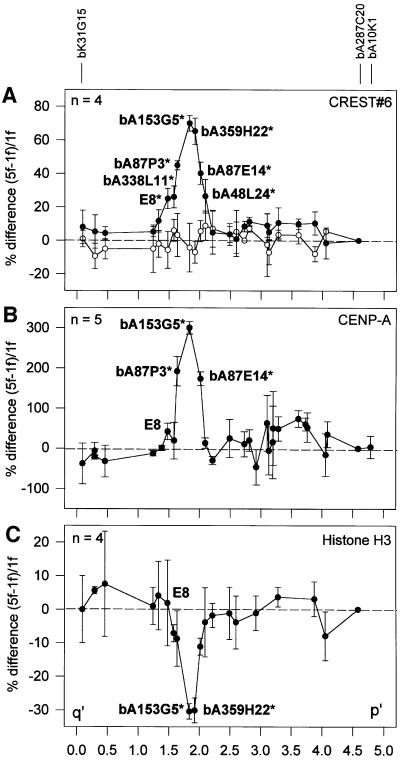
Fig. 2. Distribution of CREST#6 antigens (A), CENP-A (B) and histone H3 (C) along the 10q25.3 BAC contig as determined by the CIA procedure. The y-axis represents the percentage difference between the normalized bound/input ratio of 5f and 1f (filled circles) or the difference between 1f and the somatic cell hybrid GM10926D (open circles in A). Each data point is the mean of four or five independent experiments and is shown with standard errors. BAC locations are represented on the x-axis by their midpoints relative to the start of the contig. Positions of BACs with signals significantly deviating from the baseline (p <0.01) are indicated on the graphs with an asterisk. The position of E8 is also indicated on (B) and (C), reference BACs are indicated above the graphs, and the positions of all remaining BACs can be obtained from their relative positions in Figure 1A.

An official website of the United States government
Here's how you know
Official websites use .gov
A
.gov website belongs to an official
government organization in the United States.
Secure .gov websites use HTTPS
A lock (
) or https:// means you've safely
connected to the .gov website. Share sensitive
information only on official, secure websites.
