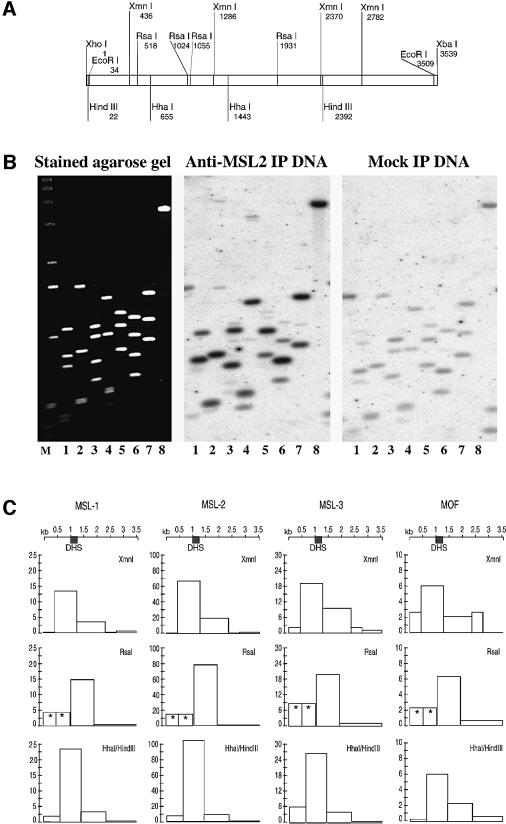
Fig. 6. Mapping of in vivo interactions of MSL proteins within the roX1 gene by chromatin immunoprecipitation. (A) Restriction map of roX1 cDNA. (B) Raw data of a representative experiment. Left panel: SYBR gold stained agarose gel containing various fragments derived from the roX1 cDNA. The cDNA was excised from pBluescript with XhoI and XbaI and gel purified (lane 8). This fragment was further digested with XmnI (lane 1), RsaI (lane 2), Esp3I–ScaI (lane 3), Esp3I–BstEII (lane 4), BanII–NsiI (lane 5), HhaI–HindIII (lane 6), EcoRI–HindIII (lane 7). Center panel: Southern blot probed with amplified DNA isolated by immunoprecipitation of SL-2 chromatin with anti-MSL2 antibody. Right panel: Southern blot using a DNA probe isolated from a mock immunoprecipitation of SL-2 chromatin (lacking a specific antibody). (C) Summary of one representative experiment. Each column shows the normalized hybridization profile obtained for the chromatin immunoprecipitation of the protein indicated above the column. Each row shows the data derived from one roX1 digest. Row 1, XmnI (see lane 1, B); row 2, RsaI (see lane 2, B); row 3, HhaI–HindIII (see lane 6, B). The y-axes of the diagrams show 1/100th of the normalized PhosphorImager counts. Note the scale changes between columns. DHS, position of the DNase I hypersensitive site as mapped in Figure 4. Asterisks indicate two fragments that could not be separated on the gel. The value indicated assumes that both fragments contribute the same signal, which is not necessarily the case.

An official website of the United States government
Here's how you know
Official websites use .gov
A
.gov website belongs to an official
government organization in the United States.
Secure .gov websites use HTTPS
A lock (
) or https:// means you've safely
connected to the .gov website. Share sensitive
information only on official, secure websites.
