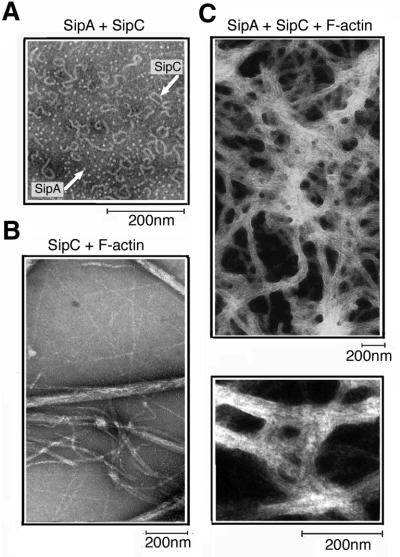
Fig. 4. Networks of bundled actin filaments generated by SipA and SipC. Transmission electron micrographs of the end-point (1200 s) corresponding to light scattering traces shown in Figure 3B. The mixture of SipA, SipC and F-actin (1:1:1; each at 2.5 µM) (C), compared with the mixture of SipC and F-actin (1:1; 2.5 µM) (B). A mixture of SipA and SipC alone (1:1; 2.5 µM) is also shown (A).

An official website of the United States government
Here's how you know
Official websites use .gov
A
.gov website belongs to an official
government organization in the United States.
Secure .gov websites use HTTPS
A lock (
) or https:// means you've safely
connected to the .gov website. Share sensitive
information only on official, secure websites.
