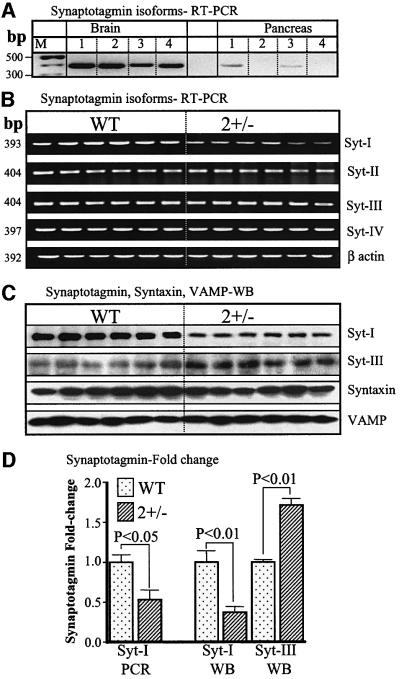
Fig. 6. Synaptotagmin, VAMP and syntaxin in wild-type and SERCA2+/– mice. For the results in (A), mRNA from brain or pancreatic acini was used to estimate relative expression of Syt isoforms in the two tissues. Note the expression of all isoforms in brain and expression of only Syt I and III in the acini and at a lower level than in brain. For the experiments in (B–D), mRNA and protein extracts from the six wild-type and six SERCA2+/– mice brains that were used to analyze PMCA protein and mRNA in Figure 3 were used to analyze by RT–PCR the level of mRNA for Syt I, II, III and IV. The experiment in (B) shows results obtained with 23 PCR cycles. Similar results were obtained in 3–5 additional experiments using between 23 and 27 cycles. (C) Western blot analysis with antibodies specific for Syt I, Syn III, syntaxin 1 and VAMP 2. Similar results were obtained in five experiments with Syt I, three experiments with Syt III, six experiments with syntaxin 1 and three experiments with VAMP2. (D) Summary of the fold changes in the indicated mRNA or protein levels for the six wild-type and six SERCA2+/– mice.

An official website of the United States government
Here's how you know
Official websites use .gov
A
.gov website belongs to an official
government organization in the United States.
Secure .gov websites use HTTPS
A lock (
) or https:// means you've safely
connected to the .gov website. Share sensitive
information only on official, secure websites.
