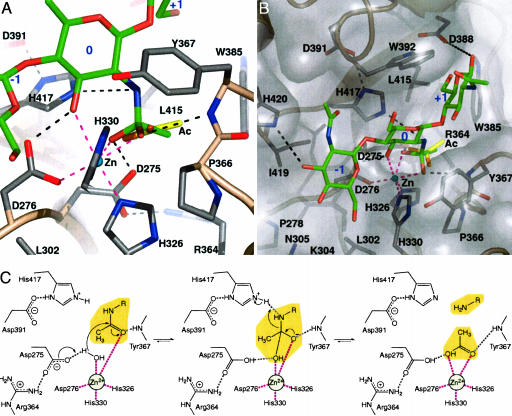
Fig. 4.
Docked GlcNAc3 complex and reaction mechanism. (A) Sp-PgdA is shown as a ribbon, with conserved side chains. The acetate molecule as observed in the SpPgdA–acetate complex (Fig. 2) is shown as yellow sticks. GlcNAc3 is shown as green sticks with subsites labeled in blue. Hydrogen bonds are shown as dashed lines in black, and zinc–ligand interactions are shown as magenta dashed lines. (B) As A, but viewed from the top. (C) Proposed catalytic mechanism.

