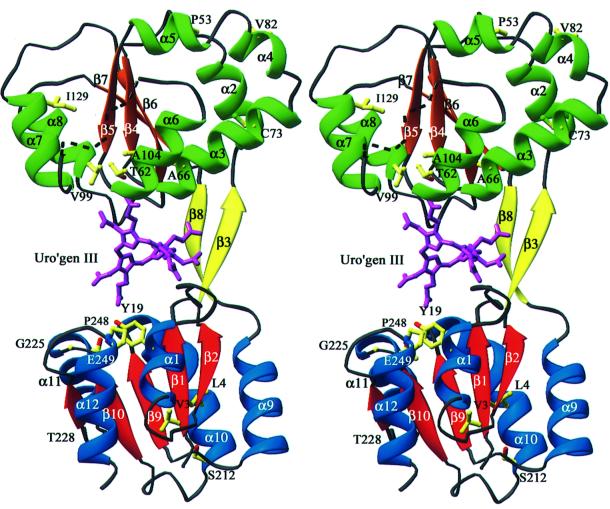
Fig. 6. Model of uro’gen III bound to U3S and location of the clinical mutations. View direction of this stereo image is similar to that in Figure 5. The side chains of residues identified as clinical mutations are shown in standard atom colors. In purple, an energy minimized model of the product, uro’gen III, has been aligned with the cobalamin molecule shown in Figure 5 and adjusted to avoid steric clashes. Note that uro’gen III is inherently very flexible and the model here is intended only to illustrate the plausibility of binding in the U3S cleft.

An official website of the United States government
Here's how you know
Official websites use .gov
A
.gov website belongs to an official
government organization in the United States.
Secure .gov websites use HTTPS
A lock (
) or https:// means you've safely
connected to the .gov website. Share sensitive
information only on official, secure websites.
