
Figure 2.
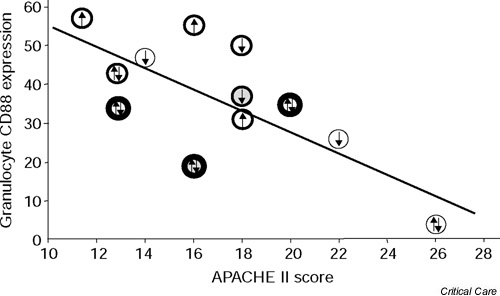
Correlation between the granulocyte CD88 expression and the APACHE II score on day 1. Upward arrows indicate an increase from onset of the severe sepsis in APACHE II score >2, and downward arrows indicate a decrease from onset of the severe sepsis in APACHE II score >2. Double-directed arrows represent changes <2.○, a patient with a duration of sepsis of 12 hours; ??, a patient with a duration of 13–24 hours; and ??, a patient with a duration >24 hours. Patients who died within 28 days are marked with shaded symbols. A regression line has been calculated using the method of least squares.