

Abstract
Myogenic spontaneous vasomotion refers to intrinsic ultra-slow (~ 0.1 Hz) oscillations in vessel tone, crucial for stabilizing cerebral blood flow and regulating cerebrospinal cord fluid flow. Recently developed quantification methods for quantitative study of vasomotion used diameter or radius indices to characterize vasomotion. However, the advantages of the radius index remain underexplored. Given the asymmetric movement of vascular walls, the radius index offers greater potential for finely describing vasomotion. A comprehensive radius vasomotion index is introduced to characterize vascular dynamics under various physiological and pathological conditions. Leveraging the enhanced sensitivity of radius index, we identified in arterioles not only the myogenic vasomotion, but also prominent oscillatory components at respiratory and heartbeat frequencies, validated by concurrent respiration and heart rate recordings. We also observed differences in vasomotion between the inner and outer sides of arteriolar bifurcations, including a notable weakening of vasomotion at inner side. Using blebbistatin, we demonstrated the regulatory role of vasomotion in cerebral blood flow. Notably, we found that myogenic vasomotion was profoundly disrupted in awake mice during the reperfusion phase following ischemic stroke. In venules, vasomotor activity was observed within both the myogenic and cardiac frequency bands and was markedly suppressed under anesthesia, while calcium oscillations in venular smooth muscle cells were not associated with myogenic vasomotion. In summary, our quantitative analysis of cerebral vascular network provides greater sensitivity and stability than the diameter index in characterizing vasomotion. Our findings underscore the utility of the radius-based approach in detecting subtle vascular dynamics and demonstrate the physiological authenticity of vasomotion frequency components.
Supplementary Information
The online version contains supplementary material available at 10.1038/s41598-025-20221-4.
Keywords: Myogenic spontaneous vasomotion, Radius vasomotion index, Cerebral blood flow, Arteriolar bifurcation, Ca2+ oscillations, Venular dynamics
Subject terms: Biophysics, Cardiology, Neuroscience, Physiology
Introduction
Cerebral vascular dynamics exhibit spontaneous oscillations across a broad spectrum of frequencies1,2, reflecting distinct physiological rhythms such as cardiac pulsation, respiratory oscillations, myogenic vasomotion, and other low-frequency processes3. Among these, myogenic vasomotion refers to the periodic contraction and dilation of cerebral vascular smooth muscle cells (SMCs), typically occurring at ~ 0.1 Hz4. Physiologically, vasomotion has been implicated in driving cerebrospinal fluid (CSF) flow within the perivascular space (PVS)5–7. A In addition, vasomotion is thought to contribute to the maintenance of cerebral blood flow (CBF) under baseline conditions8. However, its precise role in regulating local CBF remains debated9–14. This controversy arises, at least in part, from the lack of direct experimental strategies that selectively manipulate vasomotion and evaluate its causal impact on CBF regulation.
Moreover, ischemic stroke remains a leading cause of mortality and long-term disability worldwide15. Clinically, the incomplete restoration of cerebral perfusion following successful recanalization of occluded vessels is termed the no-reflow phenomenon. This impairment of microcirculatory reperfusion undermines the therapeutic efficacy of vascular recanalization and contributes to the expansion of the ischemic core, thereby exacerbating neurological deficits16. Emerging evidence suggests that impaired vasomotion after recanalization is closely associated with microvascular flow disturbances in ischemic stroke. Notably, enhancing vasomotor activity has been shown to promote the recovery of cerebral microcirculation and improve post-stroke outcomes13,14,17. A deeper understanding of these pathophysiological mechanisms may provide critical insights into stroke progression and foster the development of novel therapeutic strategies aimed at limiting secondary neuronal injury.
Research on rhythmic venular oscillations remains limited within the field of cerebral vascular dynamics, and the prevailing view is that vasomotion in venules is relatively sparse5,18,19. This apparent paucity may indeed reflect intrinsic physiological characteristics of venular oscillations, but it could also arise from technical limitations, as few experimental methodologies have been specifically optimized for studying venular dynamics. Furthermore, most current knowledge of vasomotion under pathological conditions derives from studies on arterioles, leaving the extent of venular involvement largely uncharacterized. Elucidating the nature of rhythmic venular oscillations is nevertheless crucial, given the indispensable role of venules as integral components of the cerebral microcirculatory network20.
Here, we integrated multiple algorithms to establish a comprehensive framework for analyzing vasomotion across the cerebral vascular network, enabling quantitative assessment of diverse vasomotion indices under physiological conditions. This framework incorporates vasomotion and calcium kinetics identification using the F0 smoothing algorithm17. Among the extracted metrics, the radius-based vasomotion index not only reproduced canonical diameter-based features but also demonstrated superior sensitivity and robustness, particularly in detecting respiratory and cardiac frequency components. Leveraging this advanced approach, we identified spatial heterogeneity of vasomotion across arteriolar bifurcations, with a notable reduction on the inner branch side. Furthermore, we showed that blebbistatin suppresses arteriolar vasomotion and impairs CBF recovery, and that ischemic stroke leads to marked vasomotion disruption. Importantly, we also observed the presence of rhythmic venular oscillations, which were completely abolished under anesthesia. Collectively, these findings provide novel mechanistic insights into vasomotion and establish a versatile analytical framework for investigating cerebrovascular dynamics in both physiological and pathological contexts.
Materials and methods
Animals
All mice procedures complied with the National Research Council (NIH) Guide for the Care and Use of Laboratory Animals. All animal experiment complies with Animal Research: Reporting of In Vivo Experiments (ARRIVE) guidelines and Animal Research Committee guidelines of the School of Life Sciences, Westlake University (approval no. 20-033-JJM). The following mouse lines were used: wild type (C57BL/6J), SMACreER21, PDGFRβCreER (JAX: 029684), Cdh5CreER(JAX: 006137), Ai14 (JAX: 007914), Ai4722, Ai96 (JAX: 028866). All mice were bred and maintained in a specific-pathogen-free animal room on a 12-hour light-dark cycle and provided food and water ad libitum at Westlake University Laboratory Animal Resource Center. Female rodents undergo hormonal fluctuations associated with their estrous cycle, which could potentially affect the resting state and further influence vasomotion during imaging, so all experiments used male mice offspring aged 2 to 6 months. A homeothermic heating blanket system was used for every mouse during its experimental procedures in order to continuously maintain stable physiological core temperature.
Tamoxifen administration regime
For breeding the conditional reporter mice in mural cells, temporally-controlled transgenic mouse lines of SMACreER and PDGFRβCreER mice were used. Tamoxifen (MCE, Cat# HY-13757 A/CS-2870) was intragastrically administered (15 mg/ml dissolved in corn oil, 3 mg daily for three consecutive days) in adult mice at least three weeks before the following experiments.
Anesthetization
The mice were anesthetized with three anesthetics respectively: Isoflurane gas (3% inhaled air for introduction and 1.5% for maintenance, R510-22-10, RWD Life Science), intraperitoneally injected avertin (16 ml/kg, 2.5% tribromoethyl alcohol, T48402; Sigma-Aldrich) or 1% pentobarbital sodium (10 ml/kg, 2-methyl-2-butanol, 240486; Sigma-Aldrich). For data extraction, physiological parameters (respiratory rate, heart rate, and vasomotion-derived signals) were collected within a stable anesthetic window, typically 10–50 min after induction for isoflurane anesthesia, during which both respiratory and cardiac rates remained within the optimal range (55–100 breaths/min for respiration) as defined by institutional guidelines23. For avertin and pentobarbital, comparable monitoring criteria were applied to ensure data collection under physiologically stable conditions.
Cranial window surgery
The cranial surgery was performed by drilling a 3-mm round window on the anterolateral parietal bone overlying the middle cerebral artery (MCA) territory. Afterward, the cranial window was sealed with a 3-mm round glass coverslip (Warner Instruments, CS-3R, Cat# 64–0720) with the instant adhesive (deli 502 super glue, Cat#No.7146). After cranial window placement, mice were allowed to recover for 2 weeks before two-photon (2P) in vivo imaging, to ensure that surgery-related inflammation had resolved.
Mouse model of transient middle cerebral artery occlusion surgery
The ischemic stroke was induced by middle cerebral artery occlusion (tMCAO)24,25. Briefly, mice were anesthetized by intraperitoneal injection of 1% pentobarbital sodium. Following disinfection and a midline neck incision, we exposed the common carotid artery (CCA) and external carotid artery (ECA) under the cervical triangle muscles. After ligating the distal side and the proximal side of the CCA, a small incision was subsequently made between the two ligatures. Then, a silicon rubber-coated monofilament with a rounded tip (Diccol, Cat# 7023910PK5Re) was inserted intraluminally. The monofilament was introduced along the internal carotid artery until the origin of the MCA was occluded. The monofilament was left for 2 h to prompt transient focal cerebral ischemia. Afterward, reperfusion was performed by withdrawing the monofilament for another 22 h.
Laser speckle contrast imaging (LSCI)
Blood flow in mouse brains was recorded in real-time using an RFLSI III device (RWD Life Sciences, Shenzhen, China). All mice were anesthetized with 1% pentobarbital sodium during CBF detection. The mouse scalp was removed to expose the skull bone, and saline was instilled on the skull surface to maintain its moisture before detection. The rectangle ROIs for MCA-covered cortical areas were selected for CBF measurements.
Two-photon imaging in vivo
Mice were live-imaged using a two-photon laser scanning microscope (Olympus, FLUOVIEW, FVMPE-RS) equipped with a cooled high-sensitivity GaAsP PMT detector and an ultrafast IR pulsed laser system (Spectra-Physics, InSight X3, continuously variable wavelength range 690–1300 nm). Pictures were acquired in a 512 × 512 pixels square with a 0.994-µm pixel size under a 25x water-immersion objective (Olympus, XLPLN25XWMP2, NA = 1.05). All mice were habituated to the platform with a head-fixed design for three consecutive days before imaging to avoid struggling during image acquisition. This was to ensure that the mice remained as close to a resting awake state as possible during 2P imaging. Nevertheless, we implemented simultaneous infrared camera monitoring during data collection. According to the infrared monitoring, the habituated mice usually exhibited movements in approximately 5% of the 216-second screening scanning periods and 0% of the 37.5-second line scanning periods. All data points affected by movements were excluded based on the infrared monitors (Supplementary Fig. 1). For vasomotion detection, SMACreER: Ai14 (tdTomato) was used to label the vascular walls (external diameter). The FITC-dextran (Sigma, Cat#FD2000S, 10 mg/ml) and RhoB-dextran (Sigma, Cat#R9379, 10 mg/ml) were used to detect vasomotion, which labels vascular lumens (internal diameter). Using the two metrics of external and internal diameters merely shows any differences in quantifying the vasomotion index17. For mural cell cytosolic calcium detection, we used a 960 nm excitation laser to image Ca2+ signals in PDGFRβCreER: Ai96 mice (expressing Ca2+ protein probe GCamp6s). The built-in line-scan mode, operating at a frequency of 100–200 Hz, was employed to collect 2000 cycles per episode. As for frame scanning, time-lapse images were collected at a frequency of 0.926 Hz for 200 cycles per episode.
Blebbistatin administration
Blebbistatin (MedMol, Cat#S81019) was dissolved in DMSO for stock at a concentration of 10 mg/ml. As for the working solution for intravenous injection, blebbistatin stock was diluted to 1 mg/ml with the solvent containing 40% PGE300, 5% Tween-80, and 45% normal saline.
Vessel diameter and SMC Ca2+ signal measurement
All time-lapse pictures were analyzed in Fiji (version 2.3.0/1.53f) and MATLAB (version R2021a; MathWorks). The vessel-containing images were first subjected to Gaussian filtering to reduce spatial noise. The vessel diameter was quantified from the resliced profile18,26. For Ca2+ dynamics analysis, the average green fluorescence intensity of regions of interest (ROIs) covering individual SMCs was measured.
Vessel diameter and radius definition
For the diameter-based metric, vessel boundaries were defined as the locations where the pixel intensity profile across the vessel wall reached the full width at half maximum14,17,18,26 (FWHM). The diameter was then computed as the distance between the two FWHM boundaries, under the assumptions that (i) the vessel segment approximates a cylindrical geometry, and (ii) the analyzed cross-section corresponds to the central (maximal-lumen) plane of the vessel, ensuring orthogonality to the vessel axis.
For the radius-based metric, we first estimated a smooth centerline using the least-squares method27 (LSM) to fit of the midpoint series obtained from the bilateral FWHM boundaries over time; this centerline served as a reference to reduce the influence of global vessel displacements, such as those caused by sample drift or physiological motion, while preserving side-specific wall motion. This approach is motivated and supported by our previous data showing that the two vessel walls can exhibit asynchronous motion in their time series, with differences in vasomotion phase and/or amplitude between opposite sides17. Such asynchrony can attenuate frequency components when the diameter alone is analyzed. By contrast, the radius-based approach preserves side-specific wall motion, thereby retaining oscillatory power that would otherwise be lost due to phase cancellation. To evaluate wall-specific motion, we quantified differences in vasomotion phase and amplitude between wall displacements using dynamic time warping (DTW) and cross-correlation (CC) analyses17. DTW was used to assess phase differences, with a higher DTW score indicating greater disparity in vasomotion phase, while CC was used to evaluate vasomotion amplitude correlation between two time series. This methodological framework reinforces the advantage of the radius-based approach in capturing subtle, physiologically relevant oscillations that may be obscured in diameter-based analyses.
The LSM procedure for obtaining the centerline is as follows. Assuming one variable and a linear function, the predicted centerline is expressed as:
 |
1 |
where a set of  pairs of observations
  is used to find a function relating the value of the centerline
  (dependent variable) to the values of a midpoint line
  (independent variable).
  and
and  represents the intercept and the slope of the regression line, respectively. The LSM defines the estimate of these parameters as the values which minimize sum of the squares between measurements and the predicted values. The sum of squared error
  is expressed as follows:
 |
2 |
The estimation uses the property that a quadratic expression reaches its minimum value when its derivatives vanish. Taking the derivative of  with respect to
  and
and  , setting them to zero:
 |
3 |
and
 |
4 |
Solving the Eqs. (3) and (4), the following least square estimates of  and
and  as:
as:
 |
5 |
and
 |
6 |
where  and
and  represent the means of
  and
and  , so the centerline is fitted by midpoint line using the LSM above. Using the LSM method, the centerline was identified as the inner boundary. The outer boundaries of the vessel were then determined by measuring the FWHM coordinates on both sides (Side 1 and Side 2). Then the radius of Side 1(centerline-Side 1) and Side 2 (Side 2-centerline) were subsequently calculated.
Power spectrum analysis
The Fast Fourier Transform (FFT) is employed to calculate the power spectral density of vessel diameter, radius, and mural cell calcium. Furthermore, based on the line-scan data from single vessels of mouse brains, the fundamental frequency of heartbeat is determined, and the frequency of the fundamental multiples is determined as harmonics.
Vasomotion index calculation
For myogenic spontaneous vasomotion characterization, all data used for extracting the calcium and vasomotion index must follow a normal distribution. The kinetic quantification indices including the calcium, diameter, and radius events17. Here, we defined F0 for each time point as the eighth smallest value within a time window of 40 frames, starting from 20 frame before the time point to 20 frames after the time point. These F0 baseline point for each time point produced a time series called the ‘F0 smooth’. When the amplitude of vasomotion exceeded the double standard deviation (SD) of baseline, it is defined as a single event. The kinetic quantification indexes including the calcium, diameter, and radius index. These indexes all contained parameters of frequency, SD of peak intervals (interval SD), absolute amplitude and amplitude ratio.These indices all contained parameters as follows:
 |
7 |
 |
8 |
 |
9 |
 |
10 |
Among them, frequency  means all events (
 ) obtained according to the above judgment indicators divided by the total time stacks (
 ). The interval SD (
 represents the time interval between each two consecutive events and H represents the amount of events interval number) shows the stability of time interval between two consecutive events. For the calcium index, when the calcium events come, the absolute amplitude represents the changes in GCamp6s fluorescence intensity (
 ) of this time frame, and the amplitude ratio displayed as a change in calcium (
 ) over baseline (
 ) of this time frame. For the diameter or radius index, the absolute amplitude represents the change in width values obtained from the two boundaries (
 or
or  ) when an event occurs, and the amplitude ratio indicates the change in width values over baseline. The inclusion criteria for the calcium events were similar as the events selection in vasomotion.
Quantification and statistical analysis
The numerical data concealed in raw digital images were extracted and run on the software of Fiji or MATLAB. GraphPad Prism 8 software (version 8.3.1, California, USA)was use for all statistical analyses and graphical illustrations. All statistical tests were two-tailed, and significance was assigned at p < 0.05. Normality between group samples were assessed using the Kolmogorov-Smirnov test, Lilliefors test, Jarque-Bera test and Chi square Goodness-of-Fit test. When comparing two groups of data, the paired or unpaired t-test was used if normality between sample groups was achieved. When comparing three or more groups of data, one-way ANOVA followed by Tukey’s post hoc analysis was used if normality between sample groups was achieved. The data with error bars are displayed as the means ± SD. No blinding and randomization design was needed in this work.
Results
Vasomotion analyses of cerebral vessels from mice from mice before and after anesthesia
To investigate vasomotion in different segments of the cerebral vascular network, we characterized the dynamic features of arterioles and venules in the leptomeninges of awake and anesthetized mice (Fig. 1). Only well-focused vessels were chosen for vasomotion analysis, considering the curvature of mouse brains17. Arterioles and venules can be easily identified easily based on the profound distinction in the morphology of perivascular mural cells of vascular networks in SMACreER: Rosa26-reporter mice17,22, (Fig. 1A and Supplementary Fig. 2).
Fig. 1.

Vasomotion analyses of cerebral vessels from mice from mice before and after anesthesia. (A) Experimental design of the vasomotion detection in awake and anesthetized mouse. (B) Representative still-frame of arteriole in vivo under two-photon microscopy. The yellow solid line represents the line-scan position. (C) Kymographs of pial arterioles through a cranial window in a head-fixed mouse. (D) Representative time-series amplitude ratio traces of diameter (ΔD/D0) and radius (ΔR/R0) in a mouse arteriole. (E) The representative Fourier plot across diameter and radius of awake and anesthetized mouse arterioles revealed a broad range of frequencies (0–11 Hz), with a distinct peak centered at around 0.10 Hz (myogenic vasomotion), 5.7 Hz (hypothetical heartbeat in anesthetized mouse) and 9.9 Hz (hypothetical heartbeat in awake mouse). (F, G) The average Fourier plot across diameter and radius of awake and anesthetized mouse (n = 32 arteriole diameter segments and n = 64 arteriole radius segments in 4 awake mice) revealed a broad range of frequencies (0–13 Hz). Blue band shows myogenic vasomotion (~ 0.10 Hz), no band shows hypothetical respiration in diameter index, gray band shows hypothetical respiration of anesthetized mouse in radius index (~ 0.90 Hz), red band shows hypothetical anesthetized heartbeat (2.80–5.95 Hz) and green band shows awake hypothetical heartbeat band (9.70–12.70 Hz in diameter and radius index). The hypothetical heartbeat frequency bands are more pronounced in radius index. (H) Representative still-frame of venule in vivo under two-photon microscopy. (I) Kymographs of venules under awake and anesthetized states. (J) Representative time-series amplitude ratio traces of diameter (ΔD/D0) and radius (ΔR/R0) under awake and anesthetized states. (K) The representative Fourier plot across diameter and radius of venules revealed a broad range of frequencies (0–11 Hz), the diameter index only shows the myogenic vasomotion frequency at around 0.10 Hz, while the radius index shows a distinct peak centered at around 0.10 Hz (myogenic vasomotion), 4.05 Hz (hypothetical heartbeat in anesthetized mouse) and 10.1 Hz (hypothetical heartbeat in awake mouse). (L, M) The average Fourier plot across diameter and radius of awake and anesthetized mouse (n = 8 venule diameter segments and n = 16 venule radius segments in 4 awake mice) revealed a broad range of frequencies (0–14 Hz), the diameter index only displays a small amount of myogenic vasomotion frequency band of awake mice, the hypothetical heartbeat frequency band of anesthetized mice and awake mice, while the radius index shows a distinct peak centered at around 0.10 Hz (myogenic vasomotion), 2.80–3.80 Hz (hypothetical heartbeat in anesthetized mouse) and 8.40–11.95 Hz (hypothetical heartbeat in awake mouse).
Arteriolar vasomotion were first characterized based on diameter and radius, respectively (Fig. 1A–G). Its frequency spectrum spans from ultra-low frequency to mid-high frequency (0–14 Hz), which are believed to be caused by endothelial, neurogenic, myogenic, respiratory, and cardiac activities3,17,26,28. However, few studies have compared it at a single-vessel level strictly from the same vascular segments of the same mice before and after anesthesia.
We compared a total of 32 arteriolar segments from four mice before and after reception of pentobarbital sodium (Fig. 1A–G and Supplementary Fig. 3). The kymographs and time series curves revealed a less pronounced oscillation of vascular wall motion after anesthesia compared to before (Fig. 1B,C). Interestingly, the time-series curve generated using arteriolar radius exhibited more profound difference than those using diameter (Fig. 1D). Expectedly, pentobarbital sodium anesthetic slowed down mouse heart rate, dropping from 9.90 Hz to 5.70 Hz, as revealed by the Fourier analysis (Fig. 1E). Under anesthetized state, both diameter-plotted and radius-plotted frequency spectrum revealed the energy of myogenic vasomotion was inhibited, but its frequency band still centered around a distinct peak of 0.1 Hz (Supplementary Fig. 3A and B). Differently, the radius-plotted frequency spectrum consistently showed more pronounced heart-rate frequency domain and especially the respiratory domain (Fig. 1F,G and 64 arteriolar segments from four mice). The band around 9.70–12.70 Hz has been widely assumed as the heartbeat frequency of awake mice, and the band around 2.80–5.95 Hz has been widely assumed as the heartbeat frequency of anesthetized mice. Regarding the assumed espiratory domain, among these different profiling metrics, only the anesthetized radius metric showed the most obvious but weak peak around 0.9 Hz, a consistent frequency domain with previous reports. We detected all these previously assumed bands These comparisons highlighted the uniqueness of radius-plotted frequency spectrum compared the traditionally plotted by diameter metric.
Venule is the impartible component in the vascular network, serving as the drainage of capillary beds and collects deoxygenated blood. Venular diameter changes can be found along aging, pathological blood pressure changes, or diabetes. Therefore, characterization of rhythmic venular oscillations would be also very important. However, conventional analysis used by different research groups did not detect significant vasomotion in venules and often conclude that cerebral venules do not exhibit vasomotion5,29. Notably, with our recently established strategy of high-resolution vasomotion analysis17, we detected vasomotion in venules (Fig. 1H–M). Nevertheless, it was weak as its power spectral density was lower than that of arterioles by two magnificent of orders (Fig. 1E and K). In diameter-plotted spectrum, anesthesia showed stronger inhibition than arterioles, almost eliminating the power in ~ 0.1 Hz and possible heart-beat domains (Fig. 1K and Supplementary Fig. 3C, 8 venular segments from three mice). Similarly, in radius-plotted spectrum, possible heart-beat domain was easier to be identified (Fig. 1K–M and Supplementary Fig. 3D, 16 venular segments from three mice). We did not detect possible respiratory domain (Fig. 1K–M).
In summary, we characterized and compared motor features of arterioles and venules in of cerebrovasculature under the awake and anesthetized conditions. Both type of vascular segments manifested the possible myogenic and heartbeat frequency bands, but venules seemed not exhibit possible respiratory band. We also propose that the radius vasomotion index can be a good alternative metric to plot frequency spectrum for the investigation of respiratory and heart-beat related vasomotion.
Vasomotion spectral components correspond to genuine heartbeat and respiratory oscillations during anesthesia
In the last section, we observed that the spectral components of vasomotion often contain frequency bands that likely correspond to heartbeat and respiratory rhythms. However, previous studies have not rigorously validated the physiological origins of these frequency components28. Specifically, the assignment of higher-frequency components to heartbeat and those near ~ 1 Hz to respiration has often relied on heuristic assumptions rather than direct physiological correlation1,3. To confirm whether these possible bands revealed by 2P imaging are genuine respiratory and heartbeat bands, we integrated an electrocardiogram (ECG) and an infrared camera into a 2P microscopy setup (Fig. 2A). These validation experiments had to be conducted under anesthesia due to the invasive ECG recording. Mild motions of the mouse back caused by breathing were recorded by the infrared camera. Consequently, this multimodal setup enabled real-time tracking of vascular dynamics alongside physiological rhythms, directly associating vasomotion signals with respiratory and cardiac activity (Fig. 2B–L).
Fig. 2.
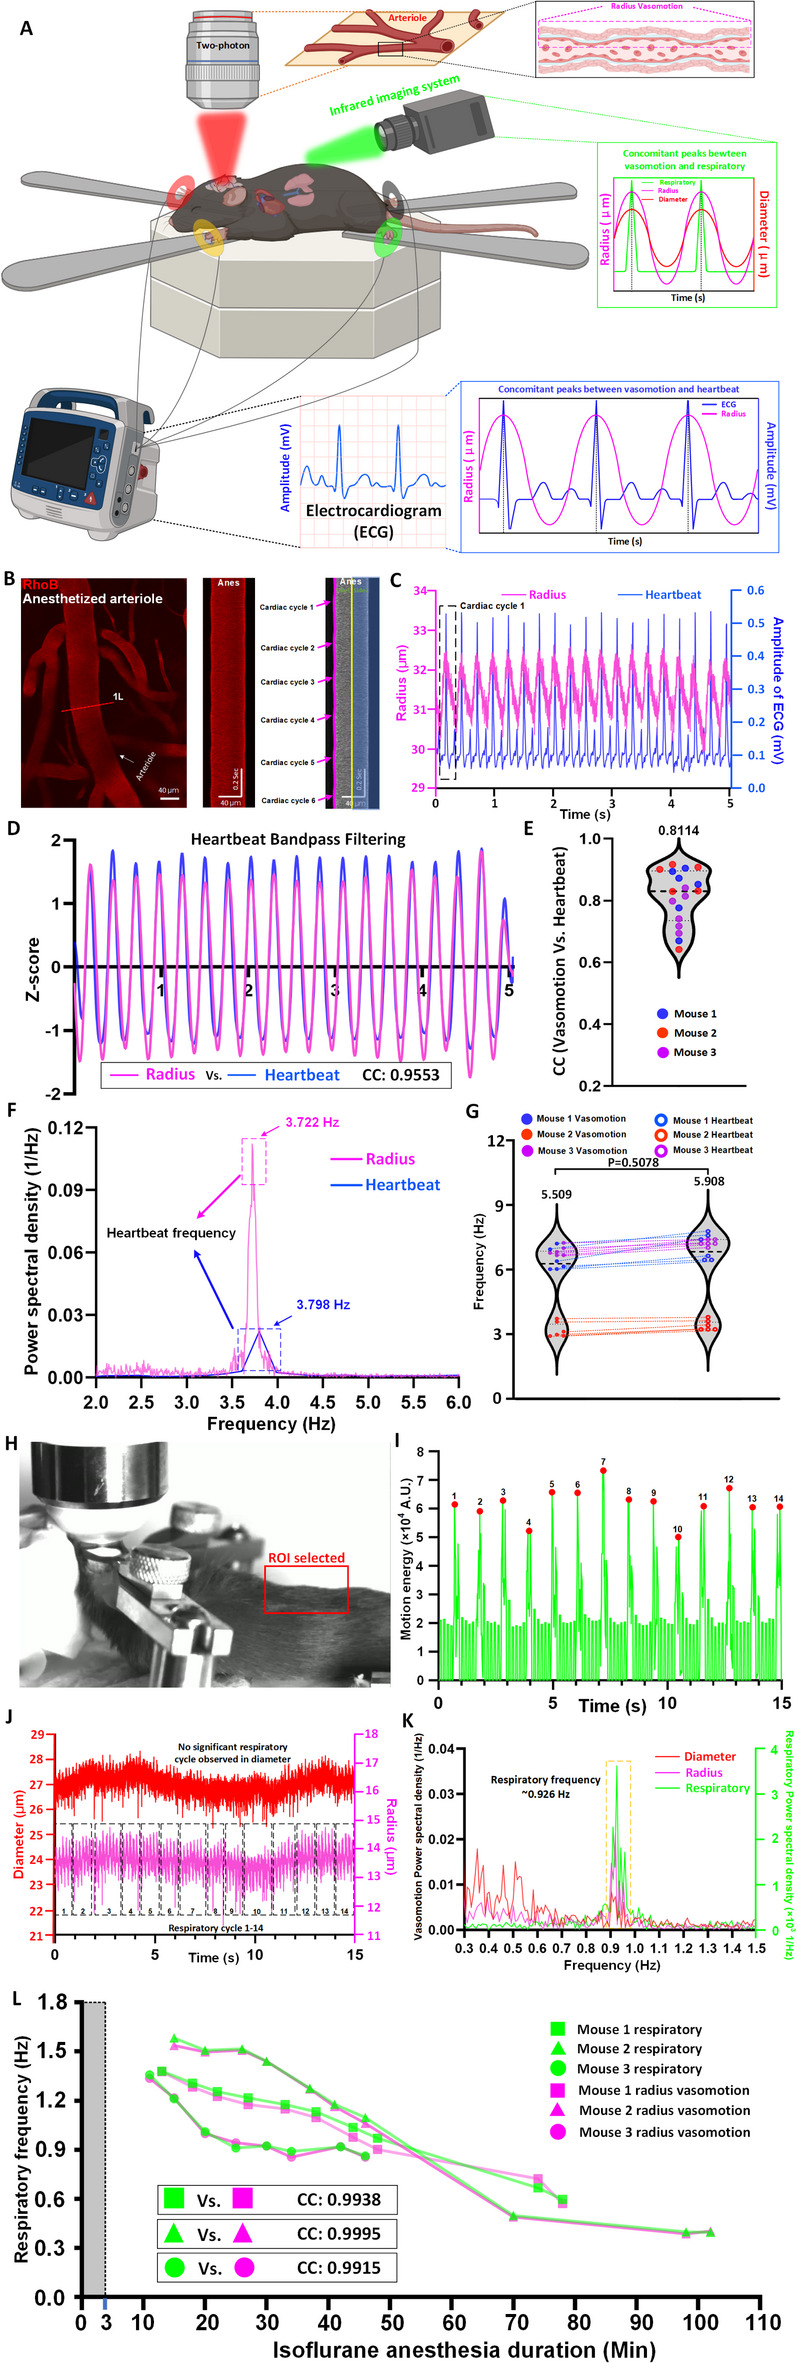
Integrated two-photon imaging and physiological monitoring reveal the respiratory and heartbeat origins of vasomotion in anesthetized mice. (A) Schematic of the integrated experimental setup combining two-photon imaging, respiratory monitoring, and heartbeat recording in an anesthetized mouse. (B) Representative still-frame and kymographs of a pial arteriole showing vasomotion cycles synchronized with heartbeat activity. (C) The correspondence in time-series curves of arteriolar radius vasomotion with the heartbeat cycles. (D) The cardiac oscillatory component was isolated, yielding a markedly higher CC value between vasomotion and ECG after applying a heartbeat-centered bandpass filter. (E) Group analysis of cardiac-band cross-correlation between vasomotion and ECG (n = 18 pairs in 3 mice). (F) The representative Fourier plot across of arterioles radius change and heartbeat monitor revealed a broad range of frequencies (0–6 Hz), with a distinct peak centered at 3.722 Hz (heartbeat recorded in two-photon microscopy vasomotion) and 3.798 Hz (heartbeat recorded in heartbeat monitor). (G) Comparison of vasomotion frequencies, driven by heartbeat activity (left), and heartbeat frequencies measured by a heartbeat monitor (right) in three anesthetized mice. (H) Photograph of the imaging setup during video recording, the selected region of interest (ROI), highlighted on the mouse’s scalp, was chosen to capture breathing-induced motion for respiratory frequency extraction. (I) Motion energy plot derived from the ROI shown in (H), representing respiratory cycles (red), peaks labeled 1–14 correspond to distinct breathing events, identified based on fluctuations in motion energy associated with respiratory movements. (J) Time-series traces of arteriole diameter (red) and radius (magenta) recorded during 14 respiratory cycles, while the radius trace reveals oscillations corresponding to the respiratory frequency band identified in (I), no clear respiratory vasomotion frequency are observed in diameter trace. (K) The representative Fourier plot across of arterioles diameter and radius change and respiratory detected video revealed a range of frequencies (0.3–1.5 Hz), a distinct respiratory peak was identified at ~ 0.926 Hz in the respiration trace, corresponding to both diameter and radius vasomotion. The respiratory frequency band was more prominently represented in the radius spectrum, while the signal in the diameter trace was weaker and potentially confounded with other low-frequency components. (L) Respiratory and radius-based vasomotion frequencies both declined over time under prolonged isoflurane anesthesia, showing strong temporal concordance. The gray column indicates the induction phase (3% isoflurane, 0–3 min), after which 1.5% isoflurane was used for maintenance. The first time point for each mouse marks the start of simultaneous video recording and two-photon imaging. Statistics for (G), paired t-tests were used.
Representative arteriolar recordings from anesthetized mice revealed that rhythmic vasomotion occurred concomitantly with heartbeat cycles (Fig. 2B,C). Based on the observations in Fig. 1, where the radius-plotted frequency spectrum consistently showed a more pronounced signal within the heart-rate frequency domain, we therefore chose to adopt radius-based vasomotion as the primary indicator in heartbeat frequency analyses.
To further test this relationship between radius-based vasomotion signals and ECG traces, we applied a heartbeat-centered bandpass filter to the radius signal, effectively isolating the cardiac oscillatory component while suppressing lower-frequency variations. This procedure markedly enhanced the correlation with ECG (Fig. 2D, CC: 0.9553). Group analysis across 18 datasets confirmed consistently high cardiac-band correlation (Fig. 2E, CC: 0.8114 ± 0.08707, n = 18 pairs of data from 3 mice). The spectral analysis confirmed the alignment of vasomotion frequency components with ECG-defined heartbeat frequencies (~ 3.7–3.8 Hz) (Fig. 2F). In three mice, vasomotion frequencies extracted from the vascular signal closely matched the corresponding heartbeat frequencies (Fig. 2G), reinforcing the physiological relevance of these high-frequency oscillations. Together, these findings indicate that vasomotion in arterioles provides a reliable and physiologically meaningful proxy for tracking the heartbeat rhythm in mice.
Moreover, respiratory motion was reliably detected via video-based monitoring (Fig. 2H,I, Movie 1). Under the anesthetized condition, vasomotion signals—particularly in radius index—displayed lower-frequency oscillations (~ 0.926 Hz) consistent with the respiratory rate (Fig. 2J–L). Unlike the radius data, diameter-plotted time series barely captured the respiratory-synchronized vasomotion (Fig. 2J). Finally, we found that following an anesthesia introduction with 3% isoflurane, when mice were maintained by 1.5% isoflurane, respiratory frequency, revealed by single-vessel recording with 2P and video-based monitor, displayed progressive decline over time (Fig. 2L). This observation not only reinforces the dynamic coupling between vasomotion and physiological state but also explains why distinct respiratory-frequency peaks were hardly observed in Fig. 1. On the one hand, such peaks were more readily captured using the radius index due to its higher sensitivity; on the other hand, respiratory frequency shifts downward with increasing anesthesia depth, further blurring its spectral distinction.
These results provide direct experimental evidence that the frequency components of vasomotion faithfully reflect authentic heartbeat and respiratory rhythms, thereby resolving a long-standing ambiguity in the field. By experimentally verifying the physiological basis of vasomotion frequency components, this study clarifies a previously unresolved assumption and paves the way for applying vasomotion as a sensitive biomarker of heartbeat and respiratory function.
Radius vasomotion index analyses reveal asymmetric vasomotion at arteriolar bifurcations undetectable by diameter-based index
Differential CSF flow speeds have been observed between the inner and outer sides of the Y-fork bifurcations of arterioles2,6. This difference in speed may reflect a distinct pattern of local vasomotion at bifurcations, since vasomotion is considered a local driver for CSF flow5. To this end, we established a radius-based vasomotion index to characterize unilateral arteriolar dynamics.
We first categorized vessels composing bifurcation into four segments relative to the bifurcation point30: main far (50–200 μm from the bifurcation point), main (< 50 μm from bifurcation), branch (< 50 μm from the bifurcation point), and branch far (50–200 μm from the bifurcation point). Each segment was further divided into side1 (outer curvature) and side2 (inner curvature) for radius measurements (Fig. 3A–D). Kymographs revealed clearly distinct vasomotion patterns across these positions, with the most pronounced disparity observed at the branch region (Fig. 3A, Movie 2). Time series analysis of normalized radius changes (ΔR/R₀) further confirmed these asymmetries, which were absent in three types of segments (main far, main and branch far) but exclusively present in the branch segment (Fig. 3C,D). In contrast, a traditional diameter-based index could not reveal this asymmetric vasomotion pattern (Fig. 3E). This analysis underscored the unique role of the radius-based method, which the diameter-based method could not replace.
Fig. 3.
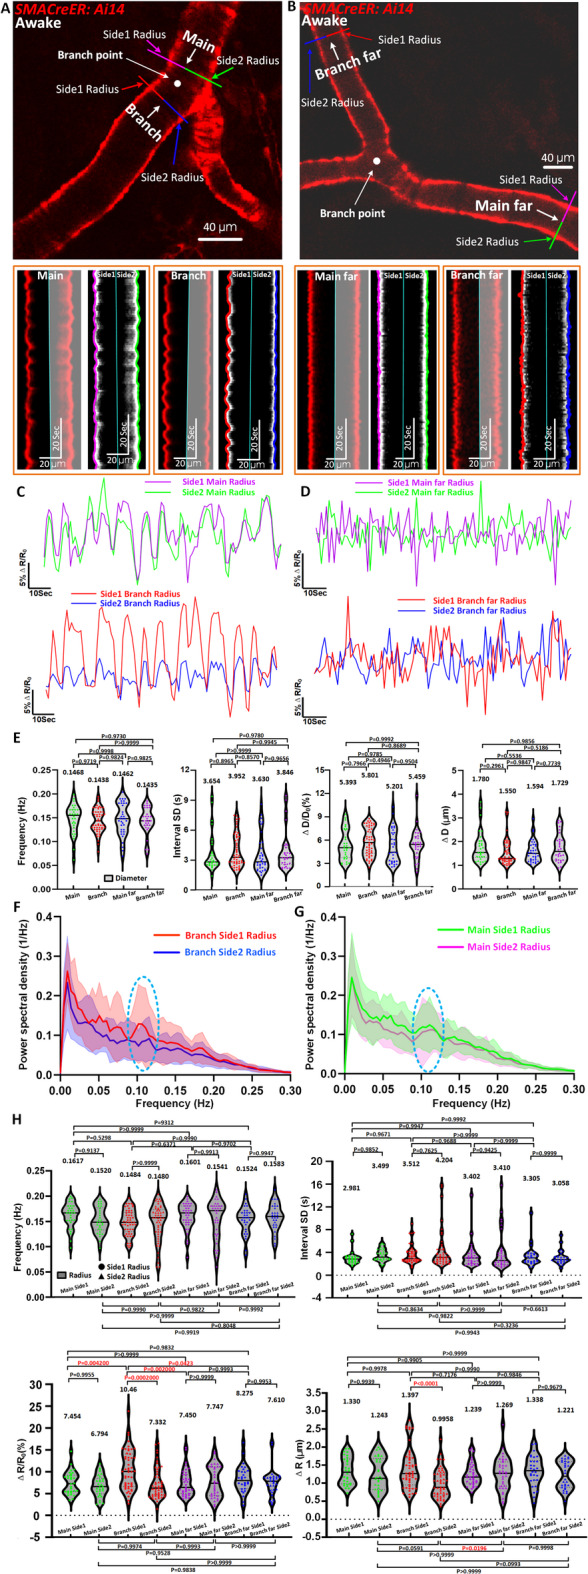
Radius vasomotion index analyses reveal vasomotion difference on both sides around the bifurcation. (A) Representative still-frame and kymographs of awake mouse pial arteriole. The red line represents the resliced position of branch side1 radius, the blue line represents branch side2 radius, the purple line represents main side1 radius, the green line represents main side2 radius. (B) Representative still-frame and kymographs of awake mouse pial arteriole. The red line represents branch far side1 radius, the blue line represents branch far side2 radius, the purple line represents main far side1 radius, the green line represents main far side2 radius. (C, D) Representative radius time-series amplitude ratio (ΔR/R0) trace of awake mouse arteriole for branch, branch far, main and main far. (E) Diameter vasomotion index statistical analysis of awake mouse (n = 51 arteriolar segments in 15 awake mice of branch position, n = 30 arteriolar segments in 10 awake mice of branch far position, n = 30 arteriolar segments in 13 awake mice of main position and n = 35 arteriolar segments in 11 awake mice of main far position). The first index represents frequency of vasomotion, the second index represents the interval SD, the third index represents the vasomotion amplitude ratio ΔD/D0 and the final index represents the absolute difference in arteriolar diameter change ΔD. The Pairwise comparisons were performed using t-tests. (F) The averaged Fourier plot across awake mouse arteriole branch side1 radius and side2 radius (n = 33 arteriolar segments in 11 awake mice) revealed a broad range of ultra-low frequencies (< 0.3 Hz), with a distinct peak centered at around 0.1 Hz (power spectral density of branch side1 > branch side2). Shaded areas represent SD. (G) The averaged Fourier plot across awake mouse arteriole main side1 radius and side2 radius (n = 28 arteriolar segments in 12 awake mice) revealed a broad range of ultra-low frequencies (< 0.3 Hz), with a distinct peak centered at around 0.1 Hz (power spectral density of main side1 ≈ main side2). (H) Radius vasomotion index statistical analysis of awake mouse corresponding to diameter vasomotion index including the frequency, interval SD, ΔR/R0 and ΔR. Statistic for (E, H), data were analyzed using one-way ANOVA, followed by Tukey’s post hoc analysis.
To exclude the possibility that these differences arise from regional heterogeneity unrelated to bifurcation structure, we performed intra-group comparisons across all four positions. There are no significant differences in radius vasomotion indices within individual regions (Supplementary Fig. 4A–C), reinforcing that the observed asymmetry is bifurcation-specific rather than a general regional variation.
Power spectral density analysis further demonstrated a prominent vasomotion peak at ~ 0.1 Hz specifically at the branch region, with side2 radii exhibiting significantly higher spectral power than side1 (33 radius segments from 11 mice; Fig. 3F). In contrast, the main vessel region showed no such asymmetry between sides (28 segments from 12 mice; Fig. 3G).
Quantitative analysis of vasomotion amplitude revealed a significant side-dependent divergence at the branch site (Fig. 3H). Specifically, side1 of the branch exhibited enhanced vasomotion, while side2 showed significantly reduced oscillatory activity (Fig. 3H, Branch side1 ΔR/R0: 10.46 ± 4.530% Vs. Branch side2 ΔR/R0: 7.332 ± 3.559%; Branch side1 ΔR: 1.397 ± 0.5605 μm Vs. Branch side2 ΔR: 0.9958 ± 0.4016 μm). This lateralized behavior at the bifurcation resulted in an overall cancellation effect when diameter-based measurements are used, explaining the lack of detectable differences via diameter indices.
Collectively, these findings not only demonstrate a unique bifurcation-associated asymmetry in arteriolar vasomotion but also establish that the radius vasomotion index offers superior spatial resolution and sensitivity. Unlike conventional diameter-based analyses, it can effectively capture fine-scale, side-specific vasodynamics, which could be critical for understanding localized hemodynamic regulation and potential functional compartmentalization at arteriolar bifurcations.
Blebbistatin suppresses pial arteriolar vasomotion, resulting in CBF decrease regardless of unchanged arteriolar diameter
To investigate whether arteriolar vasomotion plays a role in sustaining homeostatic CBF, we utilized both 2P microscopy and laser speckle contrast imaging before and after intravenous injection of blebbistatin, a selective non-muscle myosin II ATPase inhibitor. Blebbistatin disrupts actin-myosin cross-bridge cycling and thus inhibits SMC contraction31.
Kymograph analyses revealed that spontaneous vasomotion of pial arterioles was markedly suppressed as early as 8 min after blebbistatin administration, with gradual recovery by 60 min (Fig. 4A–E, Movie 3). This suppression was clearly reflected in Fourier power spectral density plots: the characteristic ~ 0.1 Hz peak associated with vasomotion was abolished post-blebbistatin and partially restored by 60 min in both diameter- and radius-based indices (Fig. 4F,G).
Fig. 4.
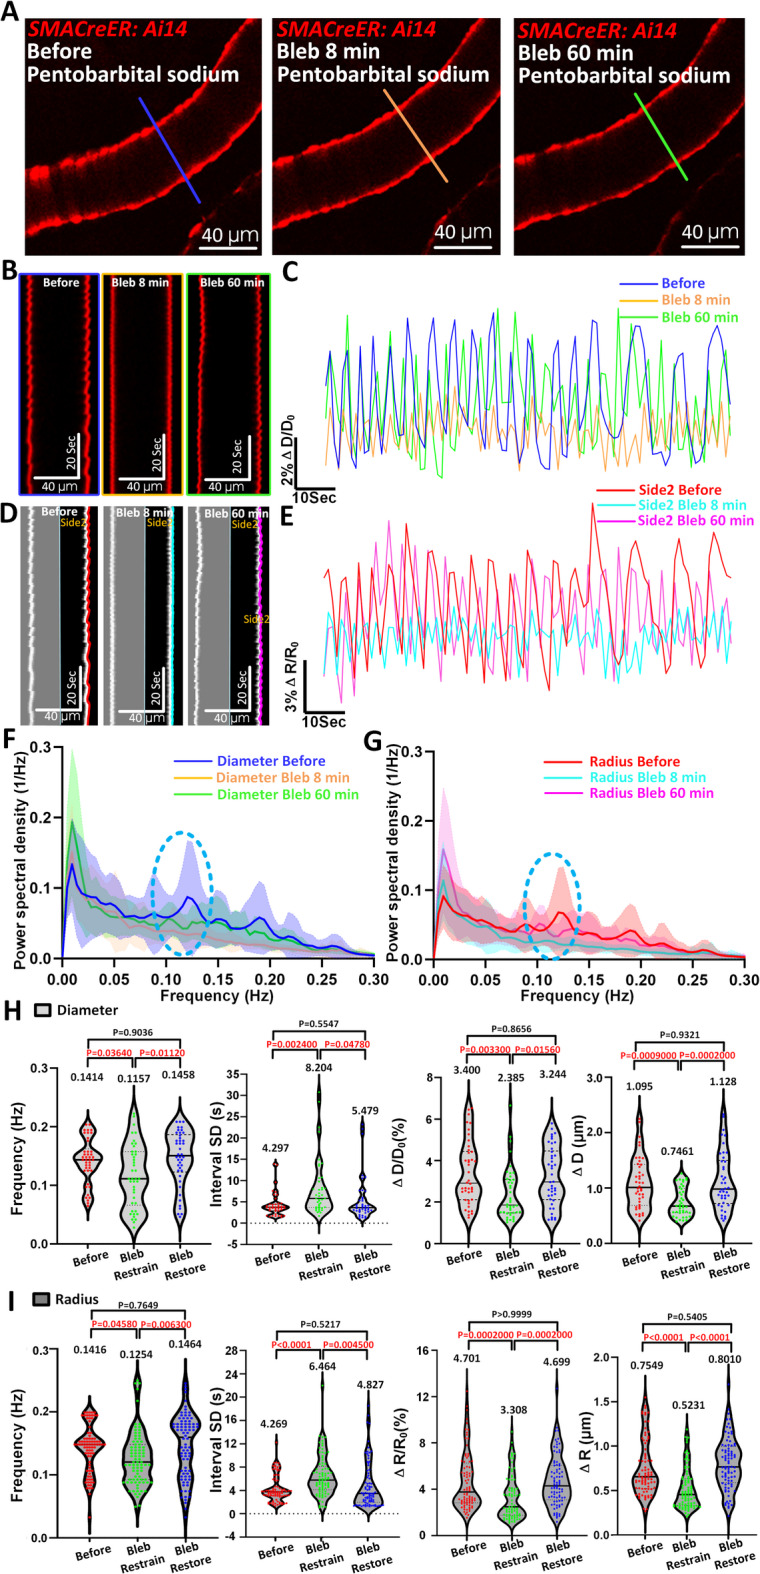
Blebbistatin suppresses arteriolar vasomotion in vivo under anesthesia. (A) Representative still-frames of pial arteriole at time of Before, Bleb 8 min and Bleb 60 min. The blue solid line represents the resliced position at time of Before, the orange line represents the resliced position at time of Bleb 8 min and the green solid line represents the resliced position at time of Bleb 60 min. (B, C) Kymographs and representative diameter time-series amplitude ratio (ΔD/D0) at time of Before, Bleb 8 min and Bleb 60 min. (D, E) Kymographs and representative side2 radius time-series amplitude ratio (ΔR/R0) at time of before, Bleb 8 min and Bleb 60 min. (F, G) The averaged Fourier plot across anesthetized mouse arteriole diameter (n = 32 arteriolar segments in 3 mice) and radius (n = 64 arteriolar segments in 3 mice) revealed a broad range of ultra-low frequencies (< 0.3 Hz), with a distinct peak centered at around 0.1 Hz at time of Before, while no distinct peak centered at around 0.1-Hz at time of Bleb 8 min and Bleb 60 min. Shaded areas represent SD. (H, I) Diameter (n = 42 arteriolar segments in 3 mice) and radius (n = 84 arteriolar segments in 3 mice vasomotion index statistical analysis in arterioles including the frequency, interval SD, ΔD/D0, ΔD, ΔR/R0 and ΔR at time of Before, Bleb 8 min and Bleb 60 min. Statistic for (H, I), data were analyzed using one-way ANOVA, followed by Tukey’s post hoc analysis.
Quantitative analysis further revealed significant reductions in vasomotion frequency, amplitude (ΔD/D₀ and ΔR/R₀), and increased temporal irregularity (interval SD) during the inhibitory phase. Specifically, diameter-based frequency dropped from 0.1414 ± 0.0385 Hz to 0.1157 ± 0.0539 Hz, and amplitude from 3.400 ± 1.522% to 2.385 ± 1.256% (Fig. 4H). Radius-based analysis showed a consistent trend: frequency decreased from 0.1416 ± 0.0376 Hz to 0.1254 ± 0.0431 Hz, and amplitude (ΔR/R₀) from 4.701 ± 2.500% to 3.308 ± 1.929% (Fig. 4I). Notably, all indices returned to baseline levels after 60 min, confirming the transient and reversible nature of blebbistatin’s effect.
To further examine how these vasomotion changes influenced cerebral blood flow at the whole-brain level, we performed LSCI measurements (Fig. 5). In parallel, laser speckle imaging demonstrated a significant reduction in CBF within the middle cerebral artery (MCA)-supplied cortex in the blebbistatin group compared to vehicle controls (Fig. 5A–C). At 8 min post-injection, CBF dropped to 84.59 ± 0.13%, whereas vehicle-treated mice maintained ~ 99.50 ± 4.40% (Fig. 5B). Interestingly, this drop in CBF occurred without any significant change in arteriolar diameter, which remained stable throughout the imaging period (Fig. 5C). To quantify this, we calculated the diameter change rate, defined as the percentage change in the vessel diameter at the same location after blebbistatin injection, relative to the pre-injection value. This clear decoupling between vascular diameter and blood flow strongly suggests that vasomotion itself indeed plays a functional role in actively driving microcirculatory flow, beyond mere structural dilation or constriction.
Fig. 5.

Blebbistatin reduces cerebral blood flow independently of arteriolar diameter. (A) LSCI images of the mouse whole brain indicate the time course changes in the CBF before, Bleb 8 min and Bleb 60 min. Magenta rectangles indicate the analyzed MCA area. (B) Statistical analysis of the relative CBF changes between experiment group (intravenous administration of blebbistatin, N = 3 mice) and control group (the same volume of the vehicle, N = 3 mice) at different time points. (C) Statistical analysis of the relative diameter changes between experiment group (intravenous administration of blebbistatin, n = 20 arterioles segments from 3 mice) at different time points. (D) The cross-correlation analysis between relative MCA blood flow and arteriolar diameter change rate at different time points after intravenous administration of blebbistatin (N = 3 mice). The different color dots represent different time points following blebbistatin administration. Statistics for (B, C), paired t-tests were used.
Consistently, correlation analysis showed no significant relationship between arteriole diameter change and MCA CBF at multiple time points (Fig. 5D), further highlighting that blebbistatin-induced CBF reduction was likely due to the loss of vasomotor oscillations rather than passive diameter regulation. Importantly, simultaneous electrocardiogram recordings revealed that such low-dose blebbistatin had minimal effect on the heartbeat rate across the above timepoints (Supplementary Fig. 5A–C).
Taken together, these results demonstrate that blebbistatin effectively inhibits arteriolar vasomotion in vivo, and this suppression leads to measurable impairment in cortical blood flow. Our findings support a functional role of vasomotion in maintaining CBF under anesthetized conditions, and suggest that loss of vasomotion—rather than gross vasoconstriction—may contribute to cerebral hypoperfusion in pathological states such as vascular dementia and Alzheimer’s disease32.
Long-lasting damage to myogenic vasomotion in awake mice that experienced a transient focal ischemic stroke
To further assess whether ischemic stroke induces pathological changes in arteriolar myogenic spontaneous vasomotion, we applied transient middle cerebral artery occlusion (tMCAO, 2 h) on the anesthetized mice. Using in vivo two-photon imaging, we captured the same MCA arterioles of the awake mice before and 22 h of reperfusion after tMCAO (RP22h). Consistent with our previous findings under anesthesia14,17, ischemic stroke markedly suppressed or even abolished spontaneous myogenic vasomotion in awake mice. This was evident from the attenuated oscillatory patterns seen in kymographs and time-series traces of both diameter and radius measurements (Fig. 6A–F, Movie 4). Fourier spectral analysis further demonstrated a profound reduction in vasomotion power within the ultra-low-frequency range (~ 0.1 Hz), with the typical frequency peak disappearing after stroke (Fig. 6G,H). These data confirmed that stroke leads to a lasting disruption in intrinsic vasomotor rhythms.
Fig. 6.

Stroke evokes long-lasting damage in myogenic vasomotion in awake mouse. (A) Representative still-frame of pial arteriole at time of Before in awake mouse. The blue solid line represents the resliced position. (B) Kymographs of awake mouse arteriole diameter and radius at time of Before. (C) Representative still-frame of arteriole at time of RP22h in awake mouse. The green solid line represents the same resliced position corresponding to the resliced position at time of Before. (D) Kymographs of arteriolar diameter and radius at time of RP22h. (E) Representative diameter time-series amplitude ratio (ΔD/D0) at time of Before and RP22h. (F) Representative side1 radius time-series amplitude ratio (ΔR/R0) at time of Before and RP22h. (G, H) The averaged Fourier plot across awake mouse arteriole diameter (n = 42 arteriolar segments in 4 mice) and radius (n = 84 arteriolar segments in 4 mice) revealed a broad range of ultra-low frequencies (< 0.3 Hz), with a distinct peak centered at around 0.1 Hz at time of Before, while no distinct peak centered at around 0.1-Hz at time of RP22h. Shaded areas represent SD. (I) Arteriole dilation at time of RP22h in awake mouse (n = 38 arteriolar segments in 4 mice). (J, K) Diameter (n = 38 arteriolar segments in 4 mice) and radius vasomotion index (n = 76 arteriolar segments in 4 mice) statistical analysis in arterioles of awake mice including the frequency, interval SD, ΔD/D0, ΔD, ΔR/R0 and ΔR at time of Before and RP22h. Statistics for (I, J, K), paired t-tests were used.
Additionally, all 38 recorded arterioles showed robust and significant dilation at 22 h post-reperfusion (Fig. 6I), consistent with previously reported vasodilation after stroke13. Importantly, amplitude-based indices of vasomotion (ΔD and ΔD/D₀) calculated from diameter traces were consistently and significantly reduced after stroke (Fig. 6J and 38 vessel segments from four mice, Before: 5.021% ± 2.400% Vs. RP22h: 2.678% ± 2.132%). However, the radius-based analysis revealed even more pronounced trend, including reductions in frequency, amplitude (ΔR, ΔR/R₀), and greater variability in oscillation intervals (Fig. 6K and 76 vessel segments from four mice, Before (Frequency): 0.1502 ± 0.03445 Hz Vs. RP22h: 0.1223 ± 0.04013 Hz; Before (ΔR/R0): 7.311 ± 3.734% Vs. RP22h: 4.039 ± 2.957%).
Together, these findings suggest that stroke induces long-lasting dysfunction in myogenic vasomotion and that radius-based metrics serve as a more sensitive and reliable indicator of vasomotor abnormalities than traditional diameter measurements. This disruption in vasodynamics may underlie impaired autoregulation and hinder cerebrovascular recovery after ischemia. Thus, preserving arteriolar vasomotion may be critical for post-stroke CBF restoration.
Venules exhibit rhythmic oscillations and are inhibited under various anesthesia methods
We previously observed signs of rhythmic oscillations in venules (Fig. 1). Given that the diameter-based vasomotion index effectively captures dynamic fluctuations around 0.1 Hz (Supplementary Fig. 3C), all subsequent analyses were performed using this index for clarity and consistency.
To further investigate the presence of rhythmic oscillations in venules, we performed comparative analyses across arterioles, venules, and capillaries in the same imaging field using Cdh5CreER: Ai47 transgenic mice, in which endothelial cells are fluorescently labeled, enabling precise vessel diameter measurements (Supplementary Fig. 6A). Since capillaries have been reported to lack vasomotion activity11, this comparison served as a functional benchmark (Supplementary Fig. 6B). Our data revealed that both arterioles and venules exhibited significantly higher vasomotion amplitudes than capillaries (Supplementary Fig. 6C, Venule (ΔD/D0): 4.457 ± 1.232% Vs. Capillary (ΔD/D0): 3.415 ± 0.5822%; Venule (ΔD): 0.5980 ± 0.1422 μm Vs. Capillary (ΔD): 0.1818 ± 0.04957 μm), confirming that venules did exhibit measurable vasomotor activity. These findings support the notion that venules, like arterioles, possess measurable rhythmic oscillations activity, prompting us to further examine how such activity varies under different physiological states.
To test whether this rhythmic venular oscillations is modifiable and thus biologically meaningful, we induced anesthesia using three commonly used anesthetics: isoflurane, avertin, and pentobarbital sodium. If rhythmic venular oscillations could be suppressed by anesthesia, this would further validate its existence and functional relevance. While it is well-established that anesthesia does not abolish arteriolar vasomotion but instead dilates baseline vessel diameter33,34, its effects on rhythmic venular oscillations remain poorly characterized.
In total, we analyzed 80 venular segments from 10 mice. Under all three anesthesia conditions, venules exhibited significant passive dilation compared to the awake state (Fig. 7A–G). Fourier spectral analysis revealed a distinct 0.1 Hz peak in awake mice, which was abolished in anesthetized states across all anesthetic agents (Fig. 7H). Notably, the vasomotion parameters across the three awake groups (assigned to different anesthetics) were comparable, ensuring baseline consistency (Supplementary Fig. 7A). Quantitatively, vasomotion amplitude decreased significantly under anesthesia (Fig. 7I–K, Awake mice: 3.001 ± 1.215% Vs. Anesthetized mice: 1.633 ± 0.8423% of isoflurane anesthesia; Awake mice: 2.907 ± 0.8397% Vs. Anesthetized mice: 1.641 ± 0.4956% of avertin anesthesia; Awake mice: 3.152 ± 0.9679% Vs. Anesthetized mice: 1.979 ± 0.4585% of pentobarbital sodium anesthesia, Movie 5). In addition, vasomotion frequency was reduced, and interval variability increased under all anesthetic conditions. All three anesthetics exhibited comparable suppressive effects on rhythmic venular oscillations under anesthesia, with no statistically significant differences among them (Supplementary Fig. 7B).
Fig. 7.

Venules exhibit spontaneous vasomotion and suppressed under anesthesia. (A–C) Representative still-frame image and kymograph of same mouse venule in both awake and corresponding anesthetized (Isoflurane, Avertin and Pentobarbital sodium) states. The blue solid line represents the resliced position of mice under awake state and the green solid represents the resliced position of mice under anesthetized state. (D–F) Representative time-lapse amplitude ratio traces of same mouse venule in both awake (blue line) and corresponding anesthetized (Isoflurane, Avertin and Pentobarbital sodium; green line) states. (G) Venule dilation in mice under Isoflurane (left, n = 33 venules segments in 4 mice), Avertin (medium, n = 27 venules segments in 3 mice) and Pentobarbital sodium (right, n = 20 venules segments in 3 mice) anesthetized states. (H) The averaged Fourier plot across mouse venule diameter change in awake state (blue line, n = 40 venules segments in 8 mice) revealed a distinct peak centered at around 0.1 Hz, while no distance peak centered at around 0.1 Hz of mice in the Isoflurane anesthetized state (green line, n = 39 venules segments in 4 mice), the Avertin anesthetized state (red line, n = 32 venules segments in 3 mice) and Pentobarbital sodium anesthetized state (cyan line, n = 24 venules segments in 4 mice). Shaded areas represent SD. (I–K) Vasomotion index comparison of mouse venules before and after Isoflurane anesthesia (n = 33 venules segments in 4 mice), Avertin anesthesia (n = 27 venules segments in 3 mice) and Pentobarbital sodium anesthesia (n = 20 venules segments in 3 mice), respectively. The different color dots represent different mice and connecting lines represent vasomotion index change of the same venule in the same mouse before and after anesthesia. Statistic for (G), data were analyzed using one-way ANOVA, followed by Tukey’s post hoc analysis. Statistics for (I, J, K), paired t-tests were used.
These consistent reductions in amplitude, frequency, and temporal regularity strongly suggested that rhythmic venular oscillations could be a genuine physiological phenomenon, not baseline noise. Our findings demonstrate that cerebral venules, like arterioles17, exhibit spontaneous myogenic vasomotion. This activity is sensitive to anesthesia, with significant suppression observed under isoflurane, avertin, and pentobarbital sodium. The data support the presence of active venular dynamics and establish a quantitative foundation for future studies on the role of rhythmic venular oscillations in cerebrovascular regulation.
Vasomotion features across the venular network and their dissociation from venular SMC Ca2+ oscillations
To investigate vasomotion characteristics across venular segments with different diameters, we stratified venular segments into four diameter-based ranks using three breakpoints derived from the quartile distribution of normalized segment diameters26. A total of 123 venular segments from 17 mice were analyzed and classified as follows: Rank 1 (65.58 < d < 114.70 μm), Rank 2 (51.05 < d < 65.58 μm), Rank 3 (34.06 < d < 51.05 μm), and Rank 4 (18.98 < d < 34.06 μm).
We next characterized vasomotion patterns across these four ranks. Representative kymographs and ΔD/D₀ traces (Fig. 8A,B) demonstrated that smaller venules, particularly those in Rank 4, exhibited more pronounced rhythmic oscillations. Although frequency and temporal variability (interval SD) of vasomotion did not significantly differ across ranks (Fig. 8C, left two panels), amplitude-based indices showed marked divergence. Specifically, ΔD/D₀ progressively increased from Rank 1 to Rank 4, suggesting greater relative fluctuations in diameter in smaller venules. Conversely, the absolute diameter change (ΔD) decreased with smaller vessel size, indicating that thinner venules exhibit higher normalized but smaller absolute oscillations (Fig. 8C, right two panels, Rank1: 1.695 ± 0.5482% Vs. Rank2: 2.047 ± 0.7855% Vs. Rank3: 2.644 ± 0.7782% Vs. Rank4: 3.478 ± 1.060%), but ΔD value decreased from 1.333 μm to 0.8995 μm (Fig. 8C).
Fig. 8.
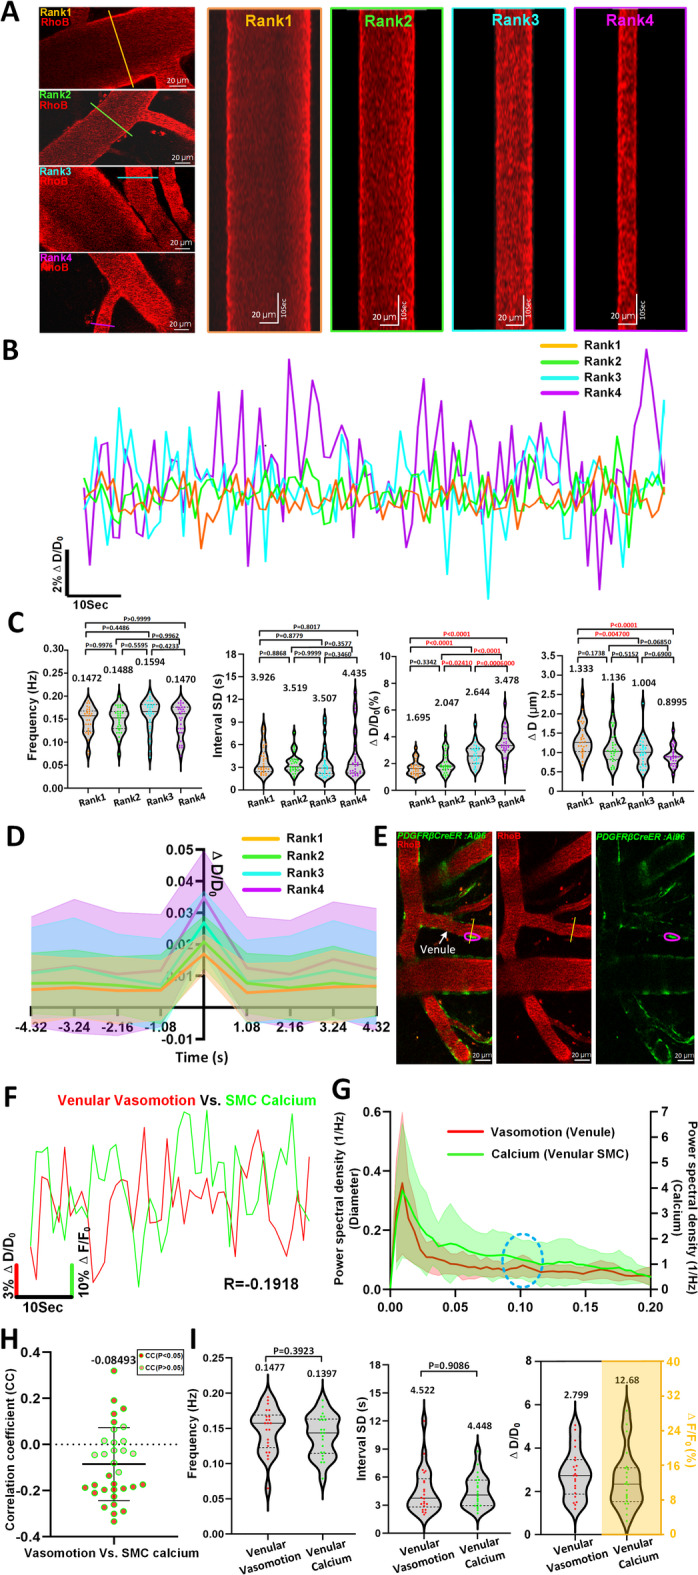
Vasomotion features in different diameter ranks of venules and relationships comparison between SMCs Ca2+ oscillations with venular vasomotions. (A) Representative still-frame image and kymograph of different rank venules. The 123 arteriolar segments collected from 17 awake mice were ranked by Quartile distribution of diameter. (Rank1: n = 30 venules segments in 12 awake mice, Rank2: n = 31 venules segments in 10 awake mice, Rank3: n = 31 venules segments in 12 awake mice, Rank 4: n = 31 venules segments in 10 awake mice). (B) Comparison of representative time-series amplitude changes trace at four diameter rank levels of venules. (C) Vasomotion index comparison of venules at four diameter ranks. (D) The averaged single vasomotion events plot comparison of venule at four diameter ranks. For venules, Rank1: n = 496 vasomotion events, Rank2: n = 478 vasomotion events, Rank3: n = 430 vasomotion events, Rank4: n = 495 vasomotion events. (E) Representative still-frame images including venules vasomotion and GCaMP6s calcium fluorescence intensity changes of corresponding SMC. (F) Representative time-series SMC calcium amplitude ratio (green solid line) and venules vasomotion amplitude ratio (red solid line) change traces of awake mouse, and the CC comparison of two time series curves. (G) The averaged Fourier plot across mouse venular diameter change in awake state revealed a distinct peak centered at around 0.1 Hz (n = 21 venules segments in 4 awake mice), while no distance peak centered at around 0.1-Hz of mice venules SMCs calcium signal change (n = 21 SMCs in 4 awake mice). Shaded areas represent SD. (H) The quantification of CC values between venular vasomotion and SMCs calcium (n = 33 pairs in 4 awake mice). (I) Comparison between diameter vasomotion index (n = 22 venules in 4 awake mice) and calcium index (n = 22 SMCs in 4 awake mice) including frequency, interval SD and ΔD/D0. Statistic for (C), data were analyzed using one-way ANOVA, followed by Tukey’s post hoc analysis. Statistics for (I), paired t-tests were used.
To further dissect vasomotion dynamics, we isolated individual dilation-contraction cycles and temporally aligned them (Fig. 8D). Each full cycle consisted of ~ 1 s dilation and ~ 1 s constriction, followed by a quiescent phase of ~ 7 s, consistent with a fundamental rhythm near 0.1 Hz. These findings collectively reveal that rhythmic oscillations is more prominent and structured in smaller venules, supporting the functional heterogeneity along the venular size spectrum.
Mural cells include arteriolar SMCs, capillary pericytes, and venular SMCs. Previous studies have indicated that the SMC Ca2+ dynamics were inversely correlated with arteriolar diameter change11,17,35. Furthermore, the identification of a peak at 0.1 Hz in calcium dynamics provides crucial evidence supporting the role of SMC Ca2+ oscillations as a driver of arteriolar vasomotion17. For capillary pericytes, while transient robust changes in GCaMP3 fluorescence were also detected, no changes in capillary diameter were identified, and thus there was no correlation between capillary pericyte calcium dynamics and changes in capillary diameter11. There is still insufficient information about the relationship between venular SMC oscillation and venular vasomotion.
To determine whether venular SMC Ca2+ dynamics contribute to rhythmic venular oscillations, we utilized awake PDGFRβCreER: Ai96 mice, in which venular SMCs express the genetically encoded calcium indicator GCaMP6s. Intravascular rhodamine labeling enabled concurrent tracking of vessel diameter and SMC Ca²⁺ fluctuations (Fig. 8E,F, Movie 6). If Ca2+ oscillations were driving vasomotion, we would expect a prominent 0.1 Hz peak in their power spectra. However, spectral analysis revealed no such peak in SMC Ca²⁺ dynamics (Fig. 8G), and correlation analysis confirmed minimal association between SMC calcium signals and vasomotion (Fig. 8H, CC: -0.08493 ± 0.1584, n = 33 pairs of data from 4 mice). Additionally, the frequency and interval SD of Ca²⁺ signals were statistically indistinguishable from those of vasomotion (Fig. 8I).
Taken together, these results indicate that rhythmic venular oscillations is largely independent of venular SMC Ca2+ oscillations, in contrast to the tight Ca2+-Ca2+-dependence observed in arterioles. This functional dissociation suggests that venular vasomotion may be governed by alternative regulatory mechanisms yet to be identified.
Discussion
In this study, we first examined intrinsic vasomotion in cerebral vessel networks, encompassing frequency bands associated with myogenic, respiratory and heartbeat vasomotion, and demonstrated the effects of anesthetics on vasomotion across these frequency bands (Fig. 1). This indicates that detecting vasomotion can provide insights into the mouse’s heartbeat and respiratory patterns. To further validate this observation, we incorporated a heartbeat monitor and motion energy-based respiration tracking to directly compare vasomotion-derived signals with independently measured physiological parameters (Fig. 2). It provides direct experimental evidence that the frequency components of vasomotion faithfully reflect authentic heartbeat and respiratory rhythms, thereby resolving a long-standing ambiguity in the field. This approach thus offers a highly feasible strategy for the efficient and real-time detection of mouse heartbeat in awake and anesthetized states, as well as respiration in anesthetized mice, enabling a rapid and accurate assessment of their physiological state. By adopting a radius vasomotion index to describe vasomotion, we first discovered vasomotion related to vascular myocytes and heartbeat in venule of mice under awake and anesthetized state (Fig. 1), then we observed the differences exist in vasomotion on either side of arteriolar bifurcations of awake mice, with vasomotion on the inside side of branching arterioles being attenuated (Fig. 3). Then, we determined that the radius vasomotion is more stable than diameter vasomotion in reflecting vasomotion frequency bands of heartbeat, and it is more sensitive in detecting the disruption of myogenic vasomotion under ischemic stroke (Figs. 1 and 6). Furthermore, we employed the myosin inhibitor blebbistatin which suppressed arterioles vasomotion and consequently restricts CBF of mice (Figs. 4 and 5). Moreover, we identified rhythmic venular oscillations and isolated single venule vasomotion events (Figs. 7 and 8). Vasomotion can serve as a valuable indicator for evaluating the health status of cerebral vessels. These comprehensive and robust quantitative descriptions of vasomotion improve our understanding of functional features of cerebral vasculature.
Additionally, investigating the connection between CSF flow velocity and vasomotion is crucial. The vasomotion on the inside side of branching arterioles is weakened, corresponding to a decrease in CSF flow velocity6. Together with previous work suggesting that vasomotion promotes CSF flow5, our findings on the amplified asymmetric movements of arteriolar bifurcation (Fig. 3) add to this understanding. Considering that CSF flow is faster near the centers of the PVS channels, but slower inside arterial bifurcations and near channel walls, these results can explain the asymmetry observed in CSF flow. It might also lead to different spatial clearing rates of b-amyloid (Ab).
Recent progress in using optogenetics to control the contractility provided a cause-effect relationship in arteriolar motor dynamics promoting CSF flow. This progress clearly demonstrated that fluctuations in arterial diameter serve as a driver for lymphatic transportation, which is widely believed to remove metabolic waste such as amyloid-beta (Aβ)36. Given that vascular Aβ depositions in patients with CAA37 and in Tg mice that overproduce Aβ38 are predominantly found in the walls of cortical arterioles and leptomeningeal arteries, as a result, Aβ clearance is more likely to occur along arteries rather than veins. Indeed, both AD patients and model animals have shown spatial differences in a Aβ deposits related to the size of arteries39–41. More specifically, since Aβ deposits within the basement membranes of vascular smooth muscle cells (VSMCs) in the tunica media in patients with CAA, this compartment is considered a major pathway for the clearance of soluble Aβ42. It has been proposed that vascular Aβ deposits render blood vessels rigid and reduce the dynamic range of affected vessel segments43. Moreover, the CAA is accompanied by loss of SMCs, which results in reduced vessel reactivity and impaired paravascular clearance of solutes. These findings have important implications for therapeutic options directed toward removal of Aβ from the brain5. Our results all suggest a tight connection between vasomotion, CSF and Ab deposition, which could give rise to new strategies targeting the manipulation of vasomotion in future therapeutic development for Alzheimer’s disease.
Furthermore, since CBF changes occurred after myosin inhibitor administration, this suggested the key role of vasomotion in the regulation of CBF (Fig. 5). It is worth noting that injecting blebbistatin can alter the metabolic status of cardiac tissue44, which may in turn influence cerebral blood flow. In our study, all experiments were performed using intravenous injection. To further clarify the direct role of vascular constriction in regulating cerebral blood flow, future studies may employ local administration of blebbistatin as a complementary approach. The regulatory effect of vasomotion on CBF (Figs. 4 and 5), combined with the finding of vasomotion deterioration during the first 22 h after recanalization14,17 (Fig. 6), suggests that abnormal vasomotion may contribute to the no-reflow in the stroke state. Improving vasomotion may be a potential direction for treating no-reflow in ischemic stroke.
Most vasomotion research has focused on arterioles, and there is no consensus on whether cerebral veins and venules also exhibit vasomotion; moreover, there is no fundamental understanding of its functional significance and underlying mechanisms. Capillaries and venules both show less prominent vasomotor activity than arterioles, but most comparative studies have focused on the differences between arterioles and capillaries, rather than differences between arterioles and venules11,33. Indeed, the ΔD/D0 value of venules is substantially smaller than that of arterioles (Figs. 7 and 8), which may explain why venules are more difficult to detect. With the baseline smoothing method, we not only detected venule vasomotion events but also revealed a characteristic 0.1 Hz peak, resembling that of arterioles. However, this peak was completely attenuated by anesthesia (Fig. 7). It is well known that anesthetics profoundly suppress gamma band neural electrical oscillations45, and this oscillation is known to entrain cerebral vasomotion46,47. Thus, this difference in the response to anesthesia strongly suggests that rhythmic venular oscillations largely depends on neural input.
Moreover, although venular SMC Ca2+ fluctuations were large (Fig. 8), which is consistent with a recent finding that venular SMCs have large, asynchronous Ca2+ fluctuations33, these fluctuations were not related to vasomotion. This implies that basal neural activity may drive venule vasomotion. However, rhythmic venular oscillations may also represent passive transmission from upstream arterioles, rather than active intrinsic regulation11,48. The underlying mechanism linking neural activity with venules therefore needs further exploration. These studies can include analyzing the impact of neural regulatory pathways on the constriction and dilation of venules, as well as investigating the effect of neural signals on venular SMCs to provide a deeper understanding of the neurovascular coupling and vessel regulatory mechanisms.
There are also some limitations in our study. Firstly, the low sampling rate of frame scanning of 2P imaging, as well as different pixel sampling times within one image. Possibly, this might lead to some deviation values in extracting vasomotion index. Alternatively, one could decrease the FOV to increase the sampling rate that can capture more higher frequency information. Another limitation is that although we combined 2PLSM and Laser Doppler to study the relationship between vasomotion and CBF of MCA, the imaging resolution of Doppler is not sufficient for distinguishing an arteriole. We could adopt the multi-line scanning mode of 2PLSM to simultaneously record vasomotion and blood flow changes of single arteriole.
In summary, we performed a systematic observation of vascular vasomotion under physiological and pathological conditions using a comprehensive and robust vasomotion index analysis method. Among them, the radius vasomotion not only reveals novel vessels physiological features, but also demonstrates stronger sensitivity and stability compared to the diameter vasomotion. This quantitative method deepened our knowledge of vasomotion function, advances our understanding of vasomotion mechanisms, and contributes to establishing new therapeutic pathways for a range of brain diseases, including Alzheimer’s disease and stroke.
Supplementary Information
Below is the link to the electronic supplementary material.
Acknowledgements
We gratefully acknowledge the constructive suggestions provided by Bing-Rui Zhao and the institutional support from the Transvascular Implantation Devices Research Institute (TIDRI).
Author contributions
Yi-Yi Zhang, Conceptualization, Resources, Data curation, Software, Formal analysis, Validation, Investigation, Visualization, Methodology, Writing original draft; Prepared Figs. 1, 2, 3, 4, 5, 6, 7 and 8. Jin-Ze Li, Resources, Conceptualization, Data curation, Formal analysis, Validation, Investigation; Wen-Tao Wang, Resources, Data curation, Formal analysis, Writing review and editing; Hui-Qi Xie, Resources, Conceptualization, Formal analysis; Jia-Yu Ruan, Resources, Conceptualization; Jie-Min Jia, Conceptualization, Funding acquisition, Project administration, Resources, Supervision, Writing review and editing.All authors reviewed the manuscript.
Funding
J.-M.J. acknowledges the support from Westlake University startup funding, the Westlake Education Foundation, HRHI programs 202309002 and 202109013 of Westlake Laboratory of Life Sciences and Biomedicine, the “Pioneer” and “Leading Goose” R&D Program of Zhejiang (grant 2024SSYS0031), the National Natural Science Foundation of China (Projects# 32170961 and #32571142), and the Hangzhou Leading Innovation Team (TD2024001).
Data availability
The data and code analysis can be available at[https://github.com/JialabEleven/Vasomotion\_analysis](https:/github.com/JialabEleven/Vasomotion_analysis) .
Declarations
Competing interests
The authors declare no competing interests.
Footnotes
Publisher’s note
Springer Nature remains neutral with regard to jurisdictional claims in published maps and institutional affiliations.
Yi-Yi Zhang, Jin-Ze Li and Wen-Tao Wang contributed equally to this work.
Contributor Information
Yi-Yi Zhang, Email: zhangyiyi@westlake.edu.cn.
Jie-Min Jia, Email: jiajiemin@westlake.edu.cn.
References
- 1.Niizawa, T. et al. Spatiotemporal analysis of blood plasma and blood cell flow fluctuations of cerebral microcirculation in anesthetized rats. J. Cereb. Blood Flow. Metab.43 (1), 138–152 (2023). [DOI] [PMC free article] [PubMed] [Google Scholar]
- 2.Meng, G. et al. Ultrafast two-photon fluorescence imaging of cerebral blood circulation in the mouse brain in vivo. Proc. Natl. Acad. Sci. U S A. 119 (23), e2117346119 (2022). [DOI] [PMC free article] [PubMed] [Google Scholar]
- 3.Kleinfeld, D. & Mitra, P. P. Spectral methods for functional brain imaging. Cold Spring Harb Protoc.2014 (3), 248–262 (2014). [DOI] [PubMed] [Google Scholar]
- 4.Mayhew, J. E. et al. Cerebral vasomotion: a 0.1-Hz Oscillation in reflected light imaging of neural activity. Neuroimage4 (3 Pt 1), 183–193 (1996). [DOI] [PubMed] [Google Scholar]
- 5.van Veluw, S. J. et al. Vasomotion as a driving force for paravascular clearance in the awake mouse brain. Neuron105 (3), 549–61e5 (2020). [DOI] [PMC free article] [PubMed] [Google Scholar]
- 6.Mestre, H. et al. Flow of cerebrospinal fluid is driven by arterial pulsations and is reduced in hypertension. Nat. Commun.9 (1), 4878 (2018). [DOI] [PMC free article] [PubMed] [Google Scholar]
- 7.Kiviniemi, V. et al. Ultra-fast magnetic resonance encephalography of physiological brain activity - Glymphatic pulsation mechanisms? J. Cereb. Blood Flow. Metab.36 (6), 1033–1045 (2016). [DOI] [PMC free article] [PubMed] [Google Scholar]
- 8.Intaglietta, M. Vasomotion and flowmotion: physiological mechanisms and clinical evidence. Vascular Med. Rev.1 (2), 101–112 (1990). vmr-. [Google Scholar]
- 9.Yemisci, M. et al. Pericyte contraction induced by oxidative-nitrative stress impairs capillary reflow despite successful opening of an occluded cerebral artery. Nat. Med.15 (9), 1031–1037 (2009). [DOI] [PubMed] [Google Scholar]
- 10.Hall, C. N. et al. Capillary pericytes regulate cerebral blood flow in health and disease. Nature508 (7494), 55–60 (2014). [DOI] [PMC free article] [PubMed] [Google Scholar]
- 11.Hill, R. A. et al. Regional blood flow in the normal and ischemic brain is controlled by arteriolar smooth muscle cell contractility and not by capillary pericytes. Neuron87 (1), 95–110 (2015). [DOI] [PMC free article] [PubMed] [Google Scholar]
- 12.Korte, N. et al. The Ca2+-gated channel TMEM16A amplifies capillary pericyte contraction and reduces cerebral blood flow after ischemia. J. Clin. Invest.132 (9). (2022). [DOI] [PMC free article] [PubMed]
- 13.Qiu, B. et al. A systematic observation of vasodynamics from different segments along the cerebral vasculature in the penumbra zone of awake mice following cerebral ischemia and recanalization. J. Cereb. Blood Flow. Metab.43 (5), 665–679 (2023). [DOI] [PMC free article] [PubMed] [Google Scholar]
- 14.Li, J. et al. Ca(2+) Oscillation in vascular smooth muscle cells control myogenic spontaneous vasomotion and counteract post-ischemic no-reflow. Commun. Biol.7 (1), 332 (2024). [DOI] [PMC free article] [PubMed] [Google Scholar]
- 15.Global National burden of stroke, 1990–2016: a systematic analysis for the global burden of disease study 2016. Lancet Neurol.18 (5), 439–458 (2019). [DOI] [PMC free article] [PubMed] [Google Scholar]
- 16.Ng, F. C. et al. Prevalence and significance of impaired microvascular tissue reperfusion despite macrovascular angiographic reperfusion (No-Reflow). Neurology98 (8), e790–e801 (2022). [DOI] [PubMed] [Google Scholar]
- 17.Zhang, Y. Y. et al. High-resolution vasomotion analysis reveals novel arteriole physiological features and progressive modulation of cerebral vascular networks by stroke. J. Cereb. Blood Flow. Metab.44 (11), 1330–1348 (2024). [DOI] [PMC free article] [PubMed] [Google Scholar]
- 18.Shih, A. Y. et al. Two-photon microscopy as a tool to study blood flow and neurovascular coupling in the rodent brain. J. Cereb. Blood Flow. Metab.32 (7), 1277–1309 (2012). [DOI] [PMC free article] [PubMed] [Google Scholar]
- 19.Drew, P. J., Shih, A. Y. & Kleinfeld, D. Fluctuating and sensory-induced vasodynamics in rodent cortex extend arteriole capacity. Proc. Natl. Acad. Sci. U S A. 108 (20), 8473–8478 (2011). [DOI] [PMC free article] [PubMed] [Google Scholar]
- 20.Fasano, A., Farina, A. & Caggiati, A. Modeling vasomotion. Reviews Vascular Med.8, 1–4 (2017). [Google Scholar]
- 21.Wendling, O., Bornert, J. M., Chambon, P. & Metzger, D. Efficient temporally-controlled targeted mutagenesis in smooth muscle cells of the adult mouse. Genesis47 (1), 14–18 (2009). [DOI] [PubMed] [Google Scholar]
- 22.Daigle, T. L. et al. A suite of Transgenic driver and reporter mouse lines with enhanced Brain-Cell-Type targeting and functionality. Cell174 (2), 465– (2018). – 80.e22. [DOI] [PMC free article] [PubMed] [Google Scholar]
- 23.Program UoMACU. Guidelines on Anesthesia and Analgesia in Mice: University of Michigan. https://az.research.umich.edu/animalcare/guidelines/guidelines-anesthesia-and-analgesia-mice/ (2025).
- 24.Longa, E. Z., Weinstein, P. R., Carlson, S. & Cummins, R. Reversible middle cerebral artery occlusion without craniectomy in rats. Stroke20 (1), 84–91 (1989). [DOI] [PubMed] [Google Scholar]
- 25.Koizumi, J., Yoshida, Y. & Nakazawa, T. A new experimental model of cerebral embolism in rats in which recirculation can be introduced in the ischemic area. Experimental studies of ischemic brain edema. I Jpn J. Stroke. 8, 1–8 (1986). [Google Scholar]
- 26.Shih, A. Y. et al. Active dilation of penetrating arterioles restores red blood cell flux to penumbral neocortex after focal stroke. J. Cereb. Blood Flow. Metab.29 (4), 738–751 (2009). [DOI] [PMC free article] [PubMed] [Google Scholar]
- 27.Björck, Å. Least squares methods. Handb. Numer. Anal.1, 465–652. (1990).
- 28.Stefanovska, A., Bracic, M. & Kvernmo, H. D. Wavelet analysis of oscillations in the peripheral blood circulation measured by laser doppler technique. IEEE Trans. Biomed. Eng.46 (10), 1230–1239 (1999). [DOI] [PubMed] [Google Scholar]
- 29.Rivadulla, C., de Labra, C., Grieve, K. L. & Cudeiro, J. Vasomotion and neurovascular coupling in the visual thalamus in vivo. PLoS One. 6 (12), e28746 (2011). [DOI] [PMC free article] [PubMed] [Google Scholar]
- 30.Wälchli, T. et al. Hierarchical imaging and computational analysis of three-dimensional vascular network architecture in the entire postnatal and adult mouse brain. Nat. Protoc.16 (10), 4564–4610 (2021). [DOI] [PubMed] [Google Scholar]
- 31.Kovács, M., Tóth, J., Hetényi, C., Málnási-Csizmadia, A. & Sellers, J. R. Mechanism of blebbistatin Inhibition of myosin II. J. Biol. Chem.279 (34), 35557–35563 (2004). [DOI] [PubMed] [Google Scholar]
- 32.Zhao, Y. & Gong, C. X. From chronic cerebral hypoperfusion to Alzheimer-like brain pathology and neurodegeneration. Cell. Mol. Neurobiol.35 (1), 101–110 (2015). [DOI] [PMC free article] [PubMed] [Google Scholar]
- 33.Glück, C. et al. Distinct signatures of calcium activity in brain mural cells. Elife10, e70591 (2021). [DOI] [PMC free article] [PubMed] [Google Scholar]
- 34.Kleinfeld, D., Mitra, P. P., Helmchen, F. & Denk, W. Fluctuations and stimulus-induced changes in blood flow observed in individual capillaries in layers 2 through 4 of rat neocortex. Proc. Natl. Acad. Sci. U S A. 95 (26), 15741–15746 (1998). [DOI] [PMC free article] [PubMed] [Google Scholar]
- 35.Glück, C. et al. Distinct signatures of calcium activity in brain mural cells. Elife10. (2021). [DOI] [PMC free article] [PubMed]
- 36.Holstein-Rønsbo, S. et al. Glymphatic influx and clearance are accelerated by neurovascular coupling. Nat. Neurosci.26 (6), 1042–1053 (2023). [DOI] [PMC free article] [PubMed] [Google Scholar]
- 37.Vinters, H. V. Cerebral amyloid angiopathy. A critical review. Stroke18 (2), 311–324 (1987). [DOI] [PubMed] [Google Scholar]
- 38.Jäkel, L., Van Nostrand, W. E., Nicoll, J. A. R., Werring, D. J. & Verbeek, M. M. Animal models of cerebral amyloid angiopathy. Clin. Sci. (Lond). 131 (19), 2469–2488 (2017). [DOI] [PubMed] [Google Scholar]
- 39.Armstrong, R. A. Classic β-amyloid deposits cluster around large diameter blood vessels rather than capillaries in sporadic alzheimer’s disease. Curr. Neurovasc. Res.3 (4), 289–294 (2006). [DOI] [PubMed] [Google Scholar]
- 40.Robbins, E. M. et al. Kinetics of cerebral amyloid angiopathy progression in a Transgenic mouse model of alzheimer disease. J. Neurosci.26 (2), 365–371 (2006). [DOI] [PMC free article] [PubMed] [Google Scholar]
- 41.Weller, R. O. et al. Cerebral amyloid angiopathy: amyloid β accumulates in putative interstitial fluid drainage pathways in alzheimer’s disease. Am. J. Pathol.153 (3), 725–733 (1998). [DOI] [PMC free article] [PubMed] [Google Scholar]
- 42.Albargothy, N. J. et al. Convective influx/glymphatic system: tracers injected into the CSF enter and leave the brain along separate periarterial basement membrane pathways. Acta Neuropathol.136 (1), 139–152 (2018). [DOI] [PMC free article] [PubMed] [Google Scholar]
- 43.Kimbrough, I. F., Robel, S., Roberson, E. D. & Sontheimer, H. Vascular amyloidosis impairs the gliovascular unit in a mouse model of alzheimer’s disease. Brain138 (Pt 12), 3716–3733 (2015). [DOI] [PMC free article] [PubMed] [Google Scholar]
- 44.Swift, L. M. et al. Properties of blebbistatin for cardiac optical mapping and other imaging applications. Pflugers Arch.464 (5), 503–512 (2012). [DOI] [PMC free article] [PubMed] [Google Scholar]
- 45.Hudetz, A. G., Vizuete, J. A. & Pillay, S. Differential effects of isoflurane on high-frequency and low-frequency γ oscillations in the cerebral cortex and hippocampus in freely moving rats. J. Am. Soc. Anesthesiologists. 114 (3), 588–595 (2011). [DOI] [PMC free article] [PubMed] [Google Scholar]
- 46.Drew, P. J., Mateo, C., Turner, K. L., Yu, X. & Kleinfeld, D. Ultra-slow oscillations in fMRI and Resting-State connectivity: neuronal and vascular contributions and technical confounds. Neuron107 (5), 782–804 (2020). [DOI] [PMC free article] [PubMed] [Google Scholar]
- 47.Mateo, C., Knutsen, P. M., Tsai, P. S., Shih, A. Y. & Kleinfeld, D. Entrainment of arteriole vasomotor fluctuations by neural activity is a basis of blood-oxygenation-level-dependent resting-state connectivity. Neuron96 (4), 936–948 (2017). e3. [DOI] [PMC free article] [PubMed] [Google Scholar]
- 48.Arciero, J. C., Causin, P. & Malgaroli, F. Mathematical methods for modeling the microcirculation. AIMS Biophys.4 (3), 362–399 (2017). [Google Scholar]
Associated Data
This section collects any data citations, data availability statements, or supplementary materials included in this article.
Supplementary Materials
Data Availability Statement
The data and code analysis can be available at[https://github.com/JialabEleven/Vasomotion\_analysis](https:/github.com/JialabEleven/Vasomotion_analysis) .