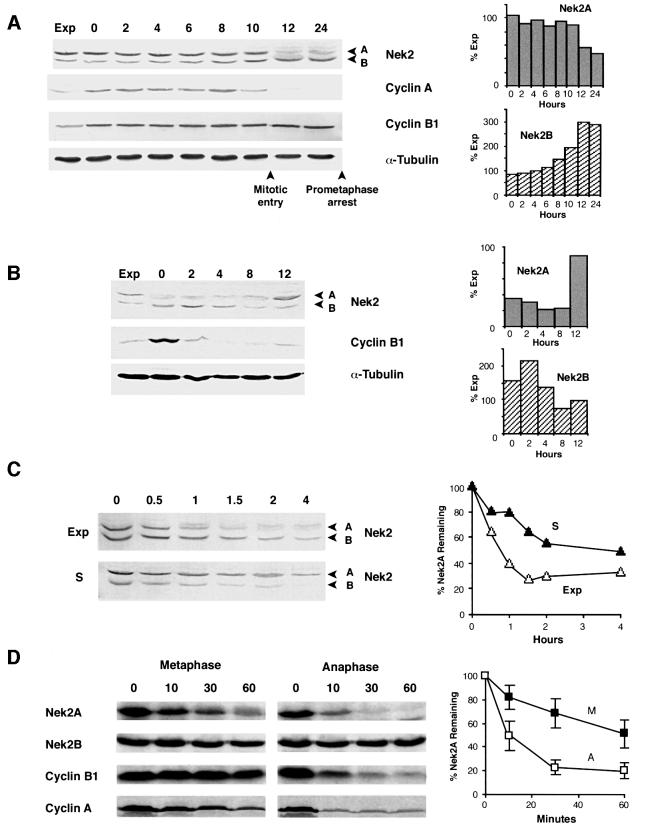
Fig. 1. Nek2A is destroyed in early mitosis. (A) Extracts prepared from exponentially growing U2OS cells (Exp) or cells released from a thymidine–hydroxyurea block into medium containing nocodazole for the times indicated (h) were immunoblotted with antibodies against Nek2, cyclin A, cyclin B1 and α-tubulin. Mitotic entry was observed by phase microscopy to occur between 10 and 12 h after release. The positions of Nek2 splice variants (A and B) are indicated. The abundance of Nek2A and Nek2B proteins present at each time point with respect to the amount in exponential cells was quantified by densitometry and is shown in the histograms on the right. (B) Immunoblots of extracts prepared following release from a nocodazole block for the times indicated (h). Again, histograms on the right show the quantified levels of Nek2A and Nek2B proteins. (C) Protein stability of Nek2A (A) and Nek2B (B) in exponential (Exp) and S phase-arrested (S) cells was measured on immunoblots of cell extracts prepared at the times indicated (h) after addition of cycloheximide. On the right, the amount of Nek2A protein remaining at each time point is plotted with respect to the amount present at time zero (Exp, open triangles; S, closed triangles). (D) In vitro degradation assays were performed by addition of 35S-labeled Nek2A, Nek2B, cyclin B1 or cyclin A to CSF extracts with (anaphase) or without (metaphase) addition of calcium. Samples were collected at the times indicated (min), separated by SDS–PAGE and exposed to autoradiography. The amount of Nek2A protein remaining at each time is plotted with respect to the amount at time zero in metaphase (M, closed squares) and anaphase (A, open squares) extracts. Results are taken from six independent experiments and error bars represent standard deviations.

An official website of the United States government
Here's how you know
Official websites use .gov
A
.gov website belongs to an official
government organization in the United States.
Secure .gov websites use HTTPS
A lock (
) or https:// means you've safely
connected to the .gov website. Share sensitive
information only on official, secure websites.
