
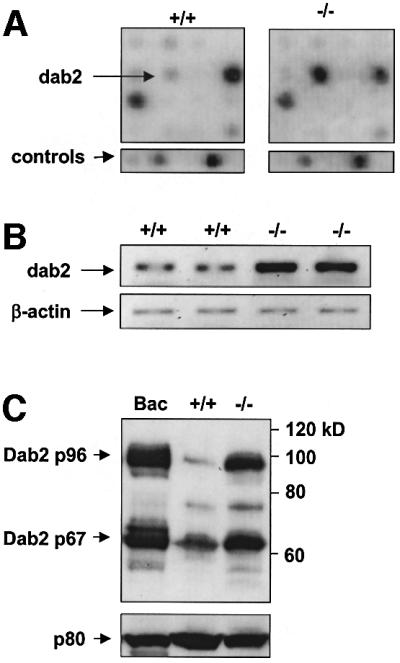
Fig. 1. Dab2 is overexpressed in ICSBP–/– BMM. (A) The hybridization patterns from ICSBP+/+ and ICSBP–/– BMM from a section of the cDNA expression arrays are shown. The arrows indicate the position of the Dab2 cDNA and of two control genes (β-actin and a 40S ribosomal protein). The arrays show a strong hybridization signal of Dab2 in ICSBP–/– but a weak signal in ICSBP+/+ BMM. (B) Semiquantitative RT–PCR analysis demonstrating the mRNA expression levels of the Dab2 gene in BMM from ICSBP+/+ and ICSBP–/– mice. (C) Western blot analysis of total protein extracts showing the different protein expression levels of Dab2 in ICSBP+/+ and ICSBP–/– BMM. Bac1.2F5 cells, expressing p96 and p67 (Xu et al., 1995), served as a control to identify the Dab2 isoforms expressed in BMM. The Dab2 proteins were detected by M2 antiserum. Equal protein loading was confirmed by the protein p80 detected by ICSBP antiserum.