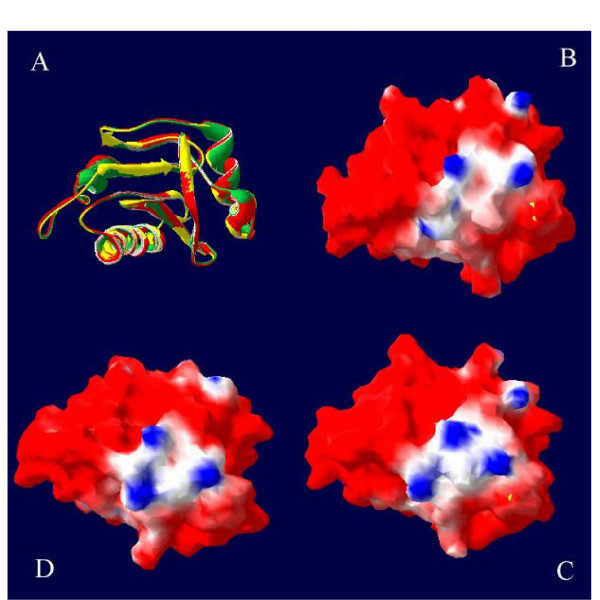
Figure 5.
(A) Superimposing of tomato (red ribbon), watermelon (green ribbon) and melon (yellow ribbon) profilin models. Electrostatic potentials at the surface of melon (B) watermelon (C) and tomato (D) profilin models. Blue represents positive potentials and red represents negative potentials. Orientations of B, C and D models are the same as in part A.

