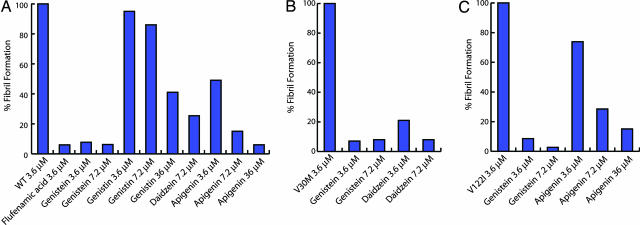
Fig. 3.
Partial acid denaturation-mediated aggregation of WT (A), V30M (B), and V122I (C) TTR. Blue bars represent data from an aggregate formation assay wherein tetrameric TTR (3.6 μM) is preincubated with inhibitor (3.6, 7.2, or 36 μM) for 30 min before lowering the pH to 4.4 (72 h). The y axis in each bar graph (optical density at 350 nm) represents aggregate formation relative to TTR (WT or variant, 3.6 μM) without inhibitor assigned as 100%. Hence 5% aggregate formation equates to 95% inhibition. The absolute turbidity OD350 values for the uninhibited reactions are WT, 1.25; V30M, 1.36; and V122I, 1.10.

