Fig. 2.
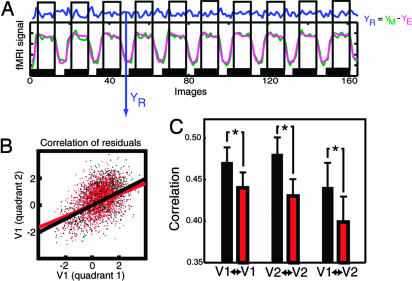
Functional connectivity analysis on residual data. (A) Residual data (blue, YR) not influenced by the main effect of stimulation were obtained for each visual quadrant from the fMRI data (green, YM) by subtraction of the data as estimated (modeled) by spm2 (pink, YE). Data were collected selectively for each attention condition and time-shifted by five images to account for the hemodynamic delay (see Materials and Methods). (B) Residual signal in two quadrants of V1 when both were attended (black) or unattended (red; data for one participant). The correlation was decreased in the unattended condition. (C) Average correlation coefficient (across participants) between quadrants that were both attended (black) or unattended (red). V1↔V1 and V2↔V2 refer to within-region correlation, and V1↔V2 refers to correlation between V1 and V2. The correlation between quadrants was significantly decreased when they were both unattended. Note that this change in correlation cannot be a consequence of differences in the main effects, because these differences were removed. Furthermore, the extraction of residuals is time-delayed by five images to avoid contamination by fMRI transients at the onset and offsets of each block. As a result, the residual signals showed no significant difference in variance under attended and unattended conditions ( and
and  ; T = 1.17; P = 0.15).

