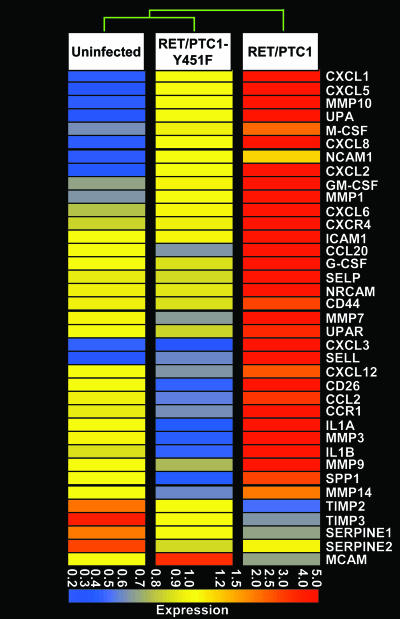
Fig. 2.
Expression plot of the inflammation/invasion-related genes regulated by RET/PTC1 oncogene. Shown is unsupervised hierarchical clustering analysis of genes related to inflammation/invasion in uninfected thyrocytes or in thyrocytes expressing RET/PTC1 or RET/PTC1-Y451F. Each row represents one probe set corresponding to one gene. The dendrogram illustrates the degree of similarity between the expression profiles of the three cell types. Different colors in the rectangles represent different levels of MAS 5-derived signals after per chip and per gene normalization (Gene Spring, Agilent Technologies, Palo Alto, CA). The color bar beneath the dendrogram represents the average expression values for this subset of genes.

