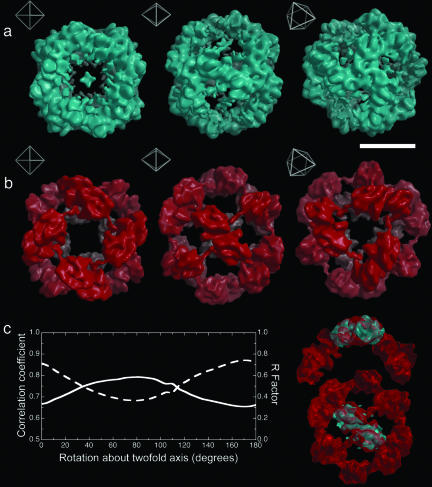
Fig. 1.
mHBsAg particle reconstructions. (a) Surface-rendered views (threshold 2.5 σ) of the small mHBsAg particle reconstruction at 12-Å resolution. Insets show the orientation of each image with respect to the octahedral symmetry of the particle. (Scale bar, 100 Å.) (b) As a for the large mHBsAg particle. (c) A plot of the real-space correlation coefficient (dashed line) and R factor (solid line) between the twofold blocks of the large and small reconstructions as they are rotated with respect to one another. The peak in correlation coefficient and trough in R factor indicate a rotation of ≈10°. On the right the twofold block from the small reconstruction (cyan) is shown fitted in this manner to that from the large reconstruction.

