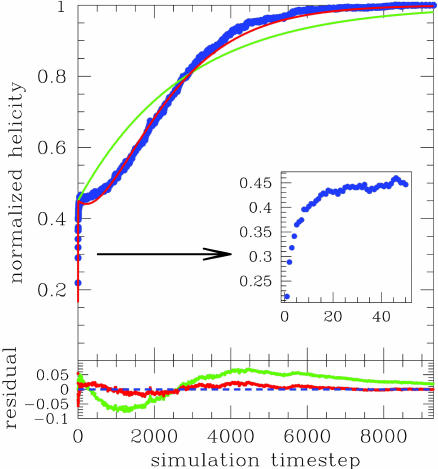
Fig. 3.
Relaxation to equilibrium of helicity content H(t) as obtained from kinetic simulations at T = 0.9Tf. The signal is normalized such that H(0) = 0 and H(t → ∞) = 1. A burst phase is clearly detected as a sudden increase of the signal up to ≈45% of its final value, within the first 0.1% of the total relaxation time. Both the fit to a two-phase kinetic model (green curve) and to a three-phase kinetic model (red curve) are overlapped to the actual simulation data (blue points). Inset zooms in on the evolution of the signal in the burst phase. The residuals from the fit are plotted in the bottom part of the figure, with colors matching the corresponding fit.

