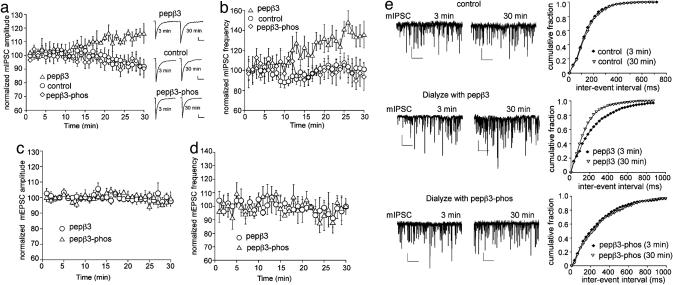
Fig. 4.
Phospho- and dephospho-GABAA receptor AP2 binding peptides have different effects on mIPSCs. (a and b) Plot of normalized mIPSC amplitude (a) and frequency (b) as a function of time in cells dialyzed with the dephosphorylated peptide (pepβ3, 200 μg/ml), the phosphorylated peptide (pepβ3-phos, 200 μg/ml), or the control internal solution (without peptide). Note that the peptide pepβ3, which binds AP2 with high affinity, increases mIPSC amplitude and frequency. Each point represents the mean ± SEM of normalized mIPSCs from 4-6 cells tested. The averaged mIPSC traces from representative cells at the third min and the 30th min (time points before and after the peptide getting into the cell) are shown in a Inset (Scale bar: 10 pA, 50 ms.). (c and d) Plot of normalized mEPSC amplitude (c) and frequency (d) as a function of time in cells dialyzed with or without different peptides. (e) Representative mIPSC traces and cumulative plots of the distribution of mIPSC frequency in cells dialyzed with or without different peptides (Scale bar: 50 pA, 2 sec.).

