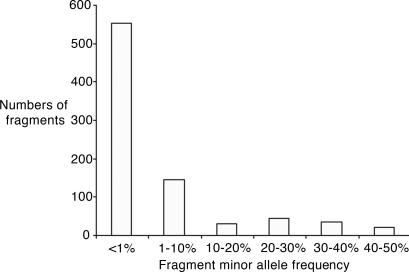
Fig. 2.
Frequency of variations discovered in the study. The frequency distribution of amplicon variation is shown, considering each amplicon as a two-allele marker (variant or nonvariant). The number of amplicons with variations at different frequencies is plotted. As can be seen, most amplicons carry variations at lower than 1% frequency. It is this wealth of data that cannot easily be assessed by using a common SNP scoring approach.

