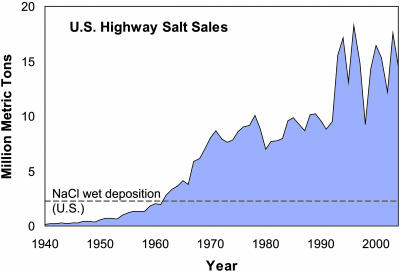
Fig. 1.
Sales of rock salt for highway use in the U.S. from 1940 to 2004 in millions of metric tons (Mg) (1, 2). The dashed line denotes our estimate of the calculated annual wet deposition of Na and Cl in the U.S., derived primarily from sea salt. The amount of Na and Cl in road salt topped Na and Cl deposition for the continental U.S. some time in the early 1960s. We estimated U.S. wet deposition of NaCl based on data from 1999-2003 using deposition isopleth maps from ref. 15. The product of mean area and deposition rates for each isopleth interval was calculated by state and summed. For Na and Cl, rates of dry deposition should be smaller than rates of wet deposition.

