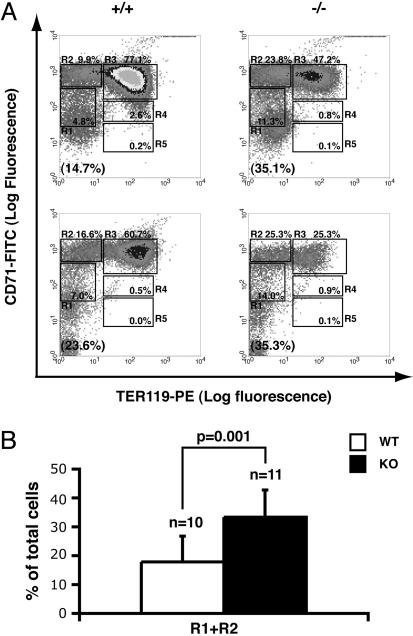
Fig. 4.
Erythroid differentiation is delayed in K-ras-deficient fetal livers. (A) Mouse FLC were freshly isolated from E12.5 embryos and double-labeled with FITC-conjugated anti-CD71 mAb and a PE-conjugated anti-TER119 mAb. Dead cells (propidium iodide positive) and debris (low forward scatter) were excluded from the analysis. (Left) Flow cytometry density plots of all viable FLC from two representative WT (+/+) embryos in two different litters. (Right) Density plots of FLC from two K-ras-/- embryos (-/-) in the same litters. Regions R1–R5 are defined as indicated. The fraction of cells in each region, R1–R5, is indicated as a percentage of all viable cells and shown on each plot. The percentage of TER119- cells (R1+R2) is labeled in the brackets at the bottom of each density plot. (B) The percentages of R1+R2 cells in 10 WT (open bar) and 11 K-ras knockout (KO, filled bar) embryos were quantified. The Student t test was performed to evaluate the statistical significance. The data presented here are the averages + SD.

