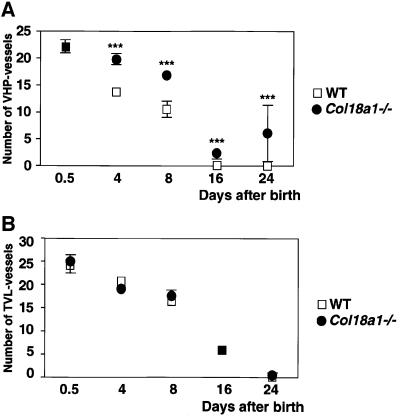
Fig. 3. The number of hyaloid vessel profiles in vitreous (A) and TVL (B) at different days in sections from wild-type (open squares, WT) and homozygous Col18a1–/– null (filled circles) mice. At each time point means of data from eight wild-type and nine Col18a1–/– mice are shown. Standard errors of the mean are indicated by vertical bars; significant differences between wild-type and knockout values are indicated by triple asterisks.

An official website of the United States government
Here's how you know
Official websites use .gov
A
.gov website belongs to an official
government organization in the United States.
Secure .gov websites use HTTPS
A lock (
) or https:// means you've safely
connected to the .gov website. Share sensitive
information only on official, secure websites.
