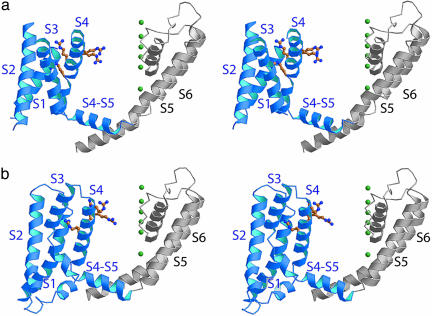
Fig. 4.
A model of KvAP based on the structure of Kv1.2. (a) A subunit of the Kv1.2 (PDB ID code 2A79) viewed from the side. The voltage sensor region (S1-S4) is colored blue, and the pore region (S5-S6) is colored gray. A queue of K+ ions (green spheres) is shown as a reference point for comparison with the KvAP model. (b) The KvAP model. The model was constructed by tilting S2-S4 helices of the KvAP structure (PDB ID code 2A0L), adjusting the S4-S5 linker to resemble the linker in the Kv1.2 structure (PDB ID code 2A79), folding the S1 helix similar to its position in the isolated voltage sensor (PDB ID code 1ORS), and repositioning the sensor slightly to account for EPR O2 (lipid) accessibility (9).

