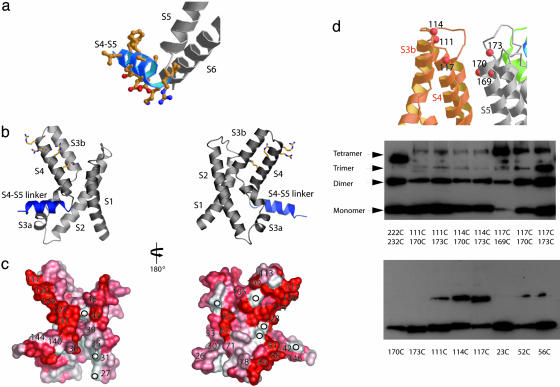
Fig. 5.
Mapping EPR O2 (lipid) accessibility data onto the voltage sensor region of the KvAP. (a) The S4-S5 linker (colored blue) of the KvAP model. The side chains of the S4-S5 linker shown as a ball-and-stick representation indicate the amphipathic nature of this linker region. (b and c) The EPR O2 (lipid) accessibility data (9) mapped onto the voltage sensor structure. O2 accessibility ranges from white (low accessibility) to red (high accessibility). Numbers in c indicate amino acid position, circles show positions where data are not available. (d) Western blot analysis of cross-linking. Membrane vesicles containing single or double Cys mutations (at numbered residues) in KvAP were subjected to air oxidation. The size of the covalent monomer, dimer, trimer, and tetramer are indicated. Residues 222 and 232 on the S6 helix were chosen as a control for cross-linking based on the crystal structure of KvAP. The 222C/232C cross-linked tetramer migrates slightly faster than the other cross-linked tetramers.

