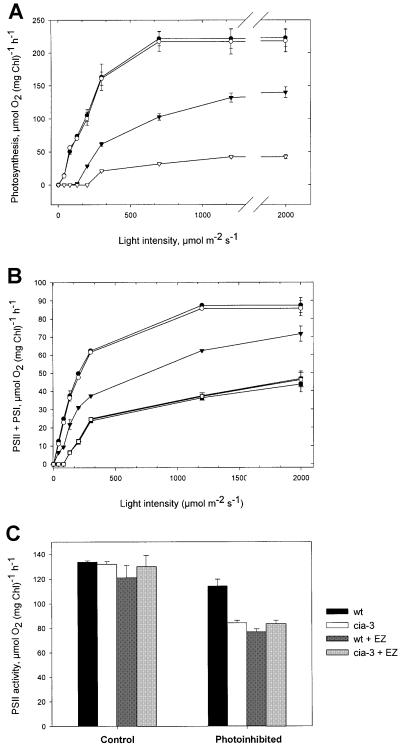
Fig. 1. Photosynthetic O2 evolution and linear electron transfer versus irradiance, and light-saturated PSII electron transport rates in wild-type and mutant cells and thylakoids. (A) Light response curves of O2 evolution from wild-type (filled symbols) and cia3 mutant (open symbols) cells of C.reinhardtii growing continuously at 150 µmol/m2/s before (circles) and after (inverted triangles) exposure to 2200 µmol/m2/s for 60 min at 26°C. The photoinhibitory treatment was carried out in test tubes of 1 cm diameter, using cell suspensions at 10 µg Chl/ml that were bubbled continuously with air enriched with 5% CO2. (B) Linear electron transport rates (measured in the presence of 1 mM methyl viologen) versus irradiance in thylakoid membranes isolated from wild-type (filled symbols) and cia3 mutant (open symbols) cells before (circles) and after photoinhibition of thylakoid membranes at 600 µmol/m2/s for 10 min in the absence (inverted triangles) or presence (squares) of 0.5 mM EZ. The photoinhibitory treatment was carried out in test tubes of 1 cm diameter. The chlorophyll concentration of the thylakoid preparations used for these experiments was 25 µg Chl/ml. (C) Light-saturated PSII electron transport rates (measured in the presence of 1 mM DCBQ, 1 mM ferricyanide and 10 µM gramicidin D) in thylakoid membranes (25 µg Chl/ml) from wild-type and mutant cells before and after photoinhibition at 600 µmol/m2/s for 10 min. Values are means ± SE (n = 4).

An official website of the United States government
Here's how you know
Official websites use .gov
A
.gov website belongs to an official
government organization in the United States.
Secure .gov websites use HTTPS
A lock (
) or https:// means you've safely
connected to the .gov website. Share sensitive
information only on official, secure websites.
