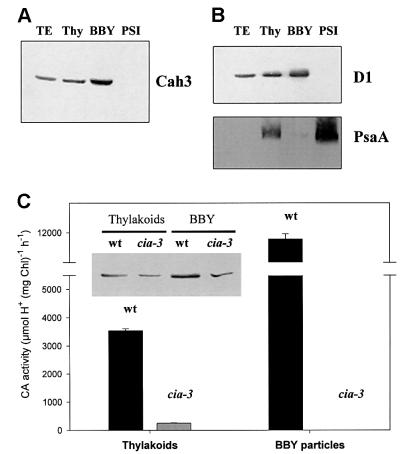
Fig. 2. Subcellular distribution of the Cah3 polypeptide and CA activity. (A) Immunoblot analysis of total cell extracts (TE), total thylakoid membranes (Thy), PSII (BBY) and PSI fractions from wild-type cells of C.reinhardtii with antibodies raised against the overexpressed Cah3 polypeptide. (B) Occurrence of cross-contamination with proteins from PSI and PSII. D1 protein was used as a marker for PSII, and PsaA as a marker for PSI. (C) CA activity measurements in thylakoid membranes and BBY preparations from both wild-type and mutant cells. Values in (C) are means ± SE (n = 4). The inset shows immunoblot analysis of thylakoid membranes and BBY preparations from both wild-type and mutant cells probed with antibodies raised against the overexpressed CA from C.reinhardtii.

An official website of the United States government
Here's how you know
Official websites use .gov
A
.gov website belongs to an official
government organization in the United States.
Secure .gov websites use HTTPS
A lock (
) or https:// means you've safely
connected to the .gov website. Share sensitive
information only on official, secure websites.
