. 2004 Oct 21;113(1):88–95. doi: 10.1289/ehp.7387
Publication of EHP lies in the public domain and is therefore without copyright. All text from EHP may be reprinted freely. Use of materials published in EHP should be acknowledged (for example, ?Reproduced with permission from Environmental Health Perspectives?); pertinent reference information should be provided for the article from which the material was reproduced. Articles from EHP, especially the News section, may contain photographs or illustrations copyrighted by other commercial organizations or individuals that may not be used without obtaining prior approval from the holder of the copyright.
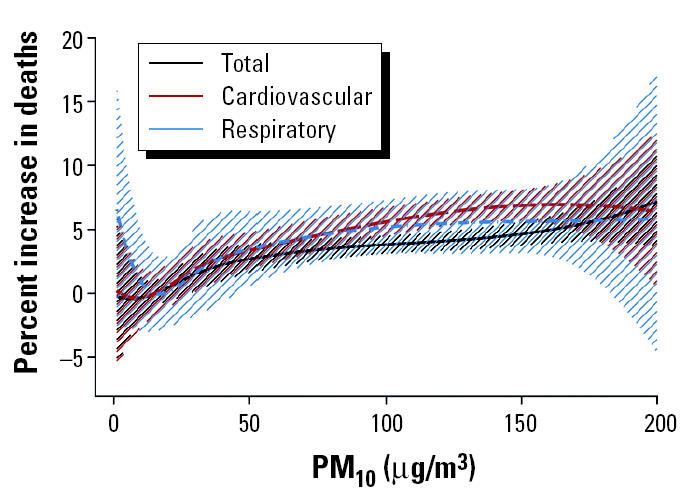
Figure 2. Exposure–response curves and 95% CIs of PM10 and total, cardiovascular, and respiratory mortality.