. 2004 Dec 8;113(3):310–316. doi: 10.1289/ehp.6933

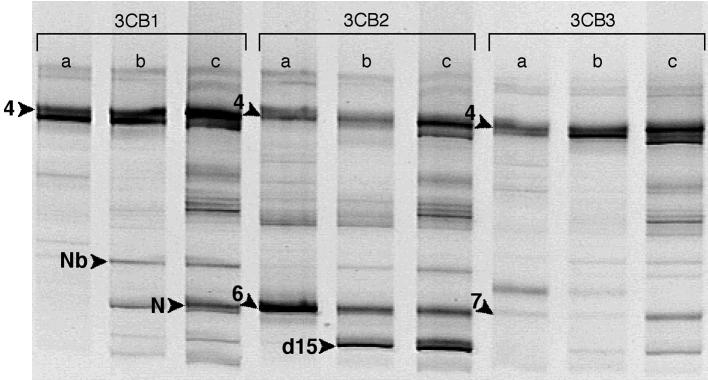
Figure 1. Ethidium bromide–stained DGGE profiles of rDNA PCR fragments derived from DNA extracted from triplicate 3-CB–degrading microcosms inoculated with Lake Michigan sediment (3CB1, 3CB2, and 3CB3) using a 20–70% denaturant gradient gel. The DNA extracts were obtained from the microcosms on the following days: lane a, day 330; lane b, day 500; lane c, day 600. Gel portions that were excised for additional analyses are indicated with arrows plus a letter and/or number. Throughout the text and in Figure 2, these bands are referred to using the microcosm name plus the label shown in Figure 1 (e.g., 3CB1-4). Sequences derived from reamplified DGGE bands were submitted to GenBank (http://www.ncbi.nlm.nih.gov/entrez/query.fcgi?db_nucleotide) with the following accession numbers: 3CB1-4, AY646230; 3CB1-Nb, AY646231; 3CB1-N, AY646232; 3CB2-4, AY646233; 3CB2-6, AY646234; 3CB2-d15, AY646235; 3CB3-4, AY646236; and 3CB3-7, AY646237.

Figure 1