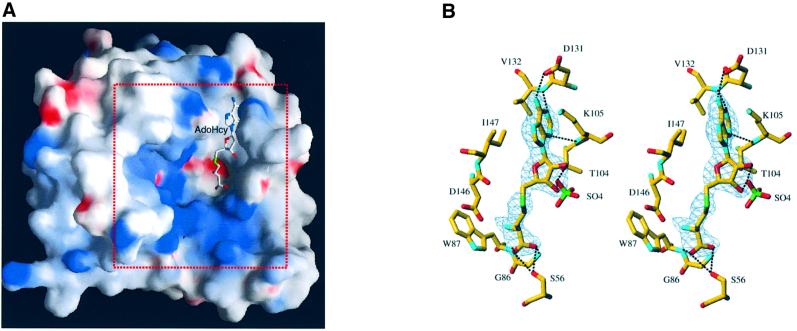
Fig. 3. The AdoMet/AdoHcy-binding site. (A) General view of the position of AdoHcy within NS5MTaseDV. The solvent-accessible surface of NS5MTaseDV was calculated and is displayed using GRASP (Nicholls et al., 1991). It has been coloured according to electrostatic potential. Potential values range from –25 kT (red) to 0 (white) to +25kT (blue), where k is the Boltzman constant and T is the temperature. The AdoHcy molecule is shown in stick representation. The area indicated by the red dotted square delineates the sector shown in detail later in Figure 7B. (B) Stereo diagram of the AdoMet/AdoHcy-binding site in NS5MTaseDV. Carbons are displayed in yellow, oxygens in red, nitrogens in cyan and sulfur in green. The Fo – Fc difference map, contoured at 3σ, was calculated at 2.4 Å resolution from a model in which the ligand was omitted. It is clear from the electron density map that the molecule is a co-product of the methyltransfer, i.e. the AdoHcy molecule. Main hydrogen bonds between NS5MTaseDV and AdoHcy are indicated by black dotted lines. Also shown is a sulfate ion, originating from the crystallization conditions. This sulfate ion is hydrogen-bonded to the 2′- and 3′-oxygen of the AdoHcy ribose. For clarity, two water molecules and Tyr219, which are also interacting via hydrogen bonds, are not represented.

An official website of the United States government
Here's how you know
Official websites use .gov
A
.gov website belongs to an official
government organization in the United States.
Secure .gov websites use HTTPS
A lock (
) or https:// means you've safely
connected to the .gov website. Share sensitive
information only on official, secure websites.
