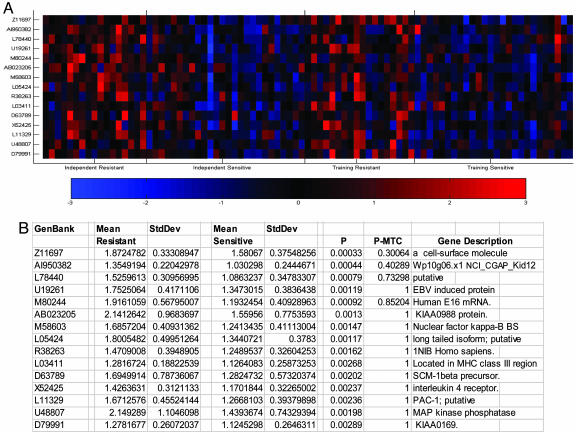
Fig. 1.
PBMC-derived gene expression profile predicting GC-R from GC-S asthma patients after exposure to IL-1β/TNF-α. (A) Differential expression of 15 genes that most accurately separated GC responders from nonresponders in the training set after cytokine treatment is shown. Genes were ranked by a metric similar to signal to noise and were considered the most differentially expressed genes according to the metric used. For each gene shown, red indicates a high level of expression relative to the mean; blue indicates a low level of expression relative to the mean. (B) Values expressed as mean ± SD are shown for the independent group. P values were obtained with a Student's t test with (P-MTC) or without (P) Bonferroni multiple testing correction. P < 0.05 is considered significant.

