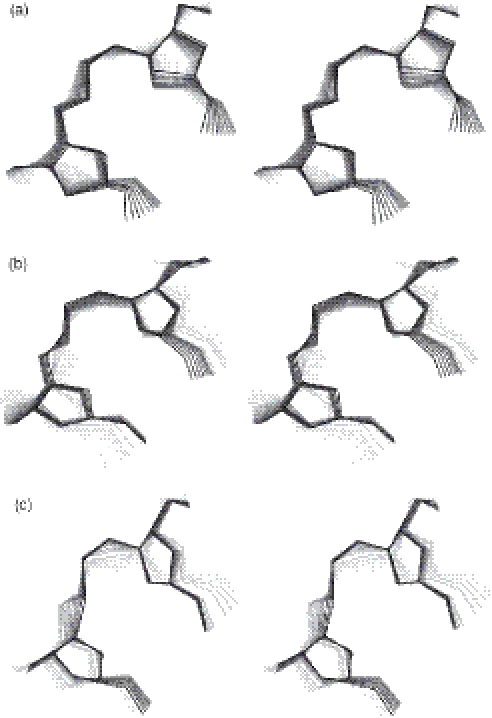
Figure 2.
Stereo (wall-eyed) diagrams showing the geometric character of the principal components. The individual panels show sequential displacements along each of the first three principal components with respect to the average structure (Table 2) over the range −200° to 200° at 20° increments for (a) PC1 and (b) PC2 and from −100° to 100° at 20° increments for (c) PC3. The colour of the lines changes from light grey to black moving from negative to positive displacements.

