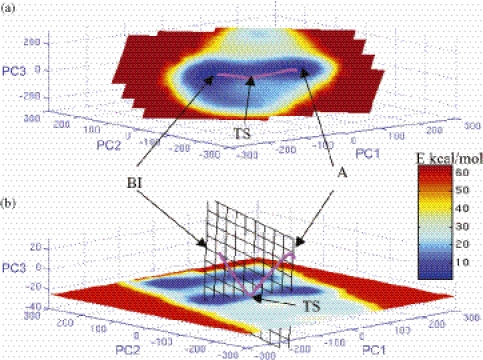
Figure 7.
Trajectories of the steepest descent path of the BI-to-A interconversion computed for a duplex d(AT)2 step (shown in magenta) projected onto the PES of a single-strand AT dinucleotide. (a) In a plane containing the two minima and the saddle points. (b) Alternative view of the trajectory in the PCS with the PES shown in the slice of the PC1–PC2 plane containing the transition states. The trajectories of the two individual strands of the duplex are very similar and not distinguishable at the resolution presented.

