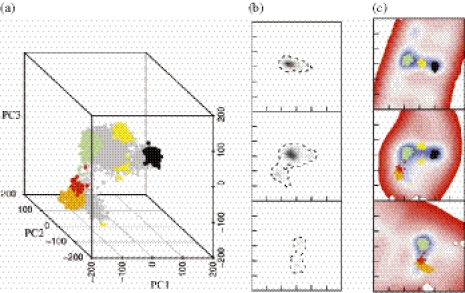
Figure 8.
Visualization of a room temperature solvated molecular dynamics simulation of the duplex hexamer d(ATATAT)2 initiated from the canonical B-form. Projection of the trajectory of the middle base step of ‘strand a’ into the PCS derived from duplex DNA crystal structures. (a) A scatter plot of the trajectory projection within the PCS. BI state is shown in green, A-form in black, BII-form in orange; BII-form is in red. Conformations with mixed sugar puckers (i.e. PA·PB or PB·PA) in yellow. (b) Density plot of the trajectory projection shown in three perpendicular planes: from top to bottom; PC1–PC2 plane at PC3 = 40, PC1–PC3 plane at PC2 = 0 and PC2–PC3 plane at PC1 = −100. In each plane, the axes extend from −300 to 300 and the tick marks are placed at 20° increments. Relative densities are indicated by gradual change from black (high density) to white (zero density). The trajectory boundary (almost zero density) is indicated by a dashed line. (c) d(AT) PES slices in the planes indicated in (b) with the conformational states indicated in (a) superposed. The colour ramp is similar to that used in Figure 3.

