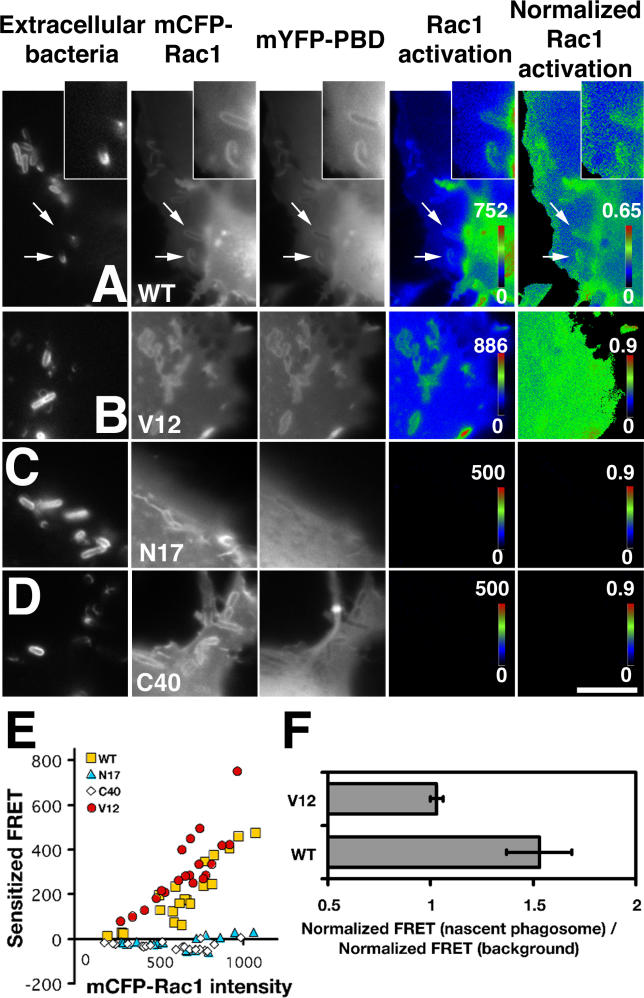
Figure 2. Localized Activation of Rac1 on the Phagosomal Membrane during Y. pseudotuberculosis Uptake.
(A–D) Transfected COS1 cells were incubated with Y. pseudotuberculosis (YPIII[P−]) for 20 min, fixed, and then immunostained with anti-Y. pseudotuberculosis to detect partially internalized bacteria (Extracellular bacteria; see Materials and Methods). Rac1 activation was measured by sensitized FRET, and normalization (Normalized FRET) was performed by determining the amount of FRET at each pixel relative to the mCFP-Rac1 intensity at that pixel (Materials and Methods). Color-gradient scales, as described in Figure 1, were used to represent the intensity of signal for Rac1 activation (Sensitized FRET) as well as for normalized Rac1 activation (Normalized FRET). Note the scales are not identical in each window. Arrows indicate nascent phagosomes, as described (Materials and Methods), and these are simultaneously displayed in insets. Shown are cotransfection of: mCFP-Rac1(WT) and mYFP-PBD (A), constitutively active mCFP-Rac1V12 with mYFP-PBD (B), dominant negative mCFP-Rac1N17 with mYFP-PBD (C), and effector binding-defective mCFP-Rac1C40 with mYFP-PBD (D). White bar represents 10 μm.
(E) FRET in response to Y. pseudotuberculosis adhesion is dependent on coexpression of active mCFP-Rac1 and mYFP-PBD. Sensitized FRET (Rac1 activation) at regions surrounding nascent phagosomes was plotted as a function of the intensity of the mCFP-Rac1 donor in the cell.
(F) The pool of Rac1 surrounding incoming bacteria is preferentially activated. The intensity of FRET that surrounded nascent phagosomes was compared to that found in nearby cytoplasmic areas, normalized against the concentration of mCFP-Rac1 found in each area, and then used to calculate the ratio of normalized Rac1 activity of nascent phagosome to that of background (Materials and Methods). Data from 20 nascent phagosomes in cells expressing mYFP-PBD along with either mCFP-Rac1(WT) or mCFP-Rac1V12 were displayed as mean ± SEM (p = 0.006).

