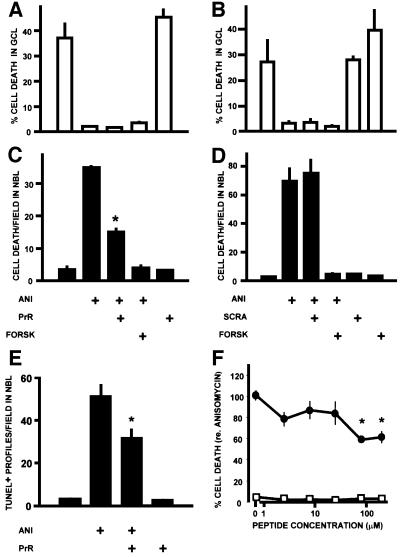
Fig. 2. Effect of the PrPc-binding peptide (PrR) upon retinal cell death. The data are shown as means ± SEM of either the percentage of degenerating cells in the single-cell thick ganglion cell layer (GCL), or the densitiy of degenerating profiles in the neuroblastic layer (NBL), in retinal explants from neonatal rats. Treatments in (A–E) are: ANI = anisomycin 1 µg/ml; PrR = PrR peptide 80 µM; SCRA = scrambled peptide 80 µM; FORSK = forskolin 10 µM. The rates of cell death evaluated by counts of pyknotic profiles in the GCL (A and B) and NBL (C and D) are shown for two representative experiments made in triplicate with either the PrR (A and C) or the scrambled control (B and D) peptides. *P < 0.01 versus anisomycin alone. In this and the following illustrations, statistical significance is indicated only for the most relevant among the multiple comparisons tabulated in the Duncan’s test. (E) Blockade of anisomycin-induced apoptosis in the NBL detected with the TUNEL technique (triplicate explants), following treatment with the PrR peptide. *P < 0.01 versus anisomycin alone. (F) Dose–response curve for the PrR peptide, either in the presence (filled circles) or in the absence of anisomycin 1 µg/ml. Each data point is the mean ± SEM of 8–16 explants from a total of five experiments, and normalized with respect to the rate of cell death (100%) induced by anisomycin. *P < 0.01 versus anisomycin alone.

An official website of the United States government
Here's how you know
Official websites use .gov
A
.gov website belongs to an official
government organization in the United States.
Secure .gov websites use HTTPS
A lock (
) or https:// means you've safely
connected to the .gov website. Share sensitive
information only on official, secure websites.
