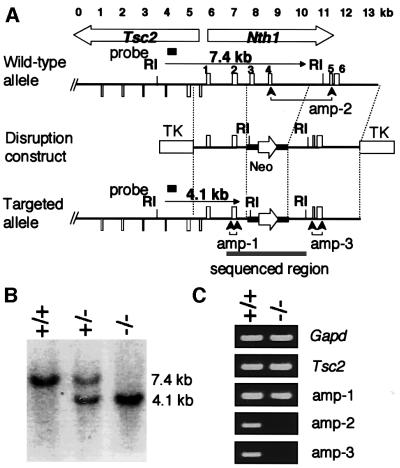
Fig. 1. Targeted disruption of the mNth1 gene. (A) Physical map of the head-to-head-oriented mTsc2-mNth1 locus of the wild type (upper map), mNth1-disruption construct (middle map) and Nth1-disrupted locus (lower map). Exons of mNth1 and a part of Tsc2 genes are indicated by upward and downward boxes, respectively. Exons 2 and 3 were replaced by a Neo marker, which is shown by a bold line with an open arrow indicating the direction of expression in the disruption construct. RI indicates the site for EcoRI. The two TKs show the positions of the thymidine kinase gene for counter-selection. The gray bar in the bottom map shows the sequenced region. Three regions directed for RT–PCR of mNth1 transcripts are indicated by amp-1, amp-2 and amp-3. (B) Genotyping by Southern blot analysis. The EcoRI-digested tail DNA from wild-type (+/+), heterozygous (+/–) and homozygous (–/–) mice was blotted and analyzed by the probe shown in (A). (C) Expression of mTsc2 and mNth1 genes. Typical results of RT–PCR using primer sets for Gapd, Tsc2 and Nth1 at three positions are shown.

An official website of the United States government
Here's how you know
Official websites use .gov
A
.gov website belongs to an official
government organization in the United States.
Secure .gov websites use HTTPS
A lock (
) or https:// means you've safely
connected to the .gov website. Share sensitive
information only on official, secure websites.
