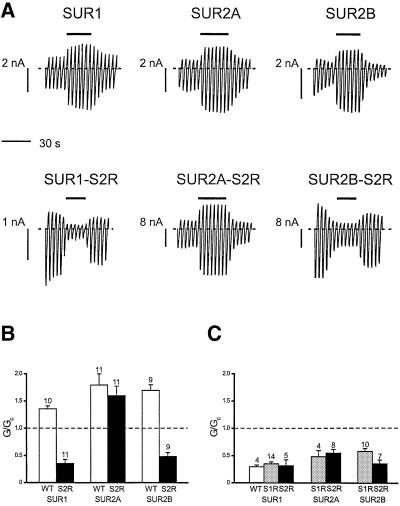
Fig. 3. (A) Macroscopic currents recorded from oocytes co-expressing Kir6.2 and either SUR1, SUR2A, SUR2B, SUR1-S2R, SUR2A-S2R or SUR2B-S2R in response to a series of voltage ramps from –110 to +100 mV. ADP (100 µM) was added to the intracellular solution as indicated by the bars. All solutions contained Mg2+. (B) Mean KATP conductance recorded in the response to 100 µM ADP in the presence of 2 mM Mg2+ from patches excised from oocytes co-expressing Kir6.2 and either wild-type SUR1, SUR2A or SUR2B (WT, white bars), or SUR1-S2R, SUR2A-S2R or SUR2B-S2R (S2R, black bars). The slope conductance (G) is expressed as a fraction of the mean of that obtained in control solution before and after exposure to MgADP (Gc). The number of patches is given above the bar. (C) Mean KATP conductance recorded in the response to 100 µM ADP in the absence of Mg2+ from patches excised from oocytes co-expressing Kir6.2 and either wild-type SUR1 (WT, white bar), or SUR1-S1R, SUR2A-S1R or SUR2B-S1R (S1R, grey bars), or SUR1-S2R, SUR2A-S2R or SUR2B-S2R (S2R, black bars). The slope conductance (G) is expressed as a fraction of the mean of that obtained in control solution before and after exposure to ADP (Gc). The number of patches is given above the bar.

An official website of the United States government
Here's how you know
Official websites use .gov
A
.gov website belongs to an official
government organization in the United States.
Secure .gov websites use HTTPS
A lock (
) or https:// means you've safely
connected to the .gov website. Share sensitive
information only on official, secure websites.
