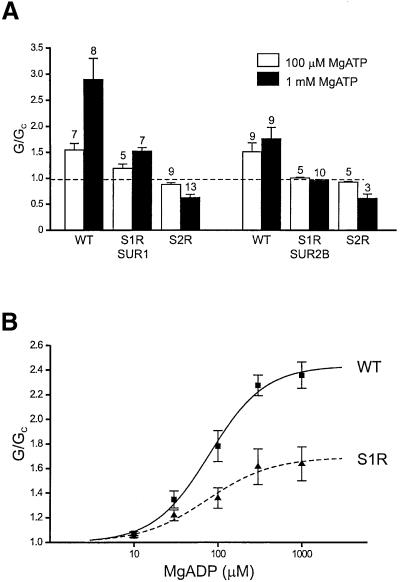
Fig. 4. (A) Mean KATP conductance recorded in response to 100 µM or 1 mM MgATP from patches excised from oocytes co-expressing Kir6.2-R50G and either wild-type or mutant SUR1 or SUR2B as indicated. The slope conductance (G) is expressed as a fraction of the mean of that obtained in control solution before exposure to MgADP (Gc). The number of patches is given above each bar. (B) Mean relationship between KATP channel activation and MgADP concentration for Kir6.2-R50G/SUR1 (black squares; n = 3–5) and Kir6.2-R50G/SUR1-S1R (black triangles; n = 4–8). The slope conductance (G) is expressed as a fraction of the mean of that obtained in control solution before and after exposure to MgADP (Gc). The lines are fitted to the modified Hill equation:
where EC50 is the MgADP concentration that gives half-maximal response and L is the maximal activation. For Kir6.2-R50G/SUR1, L = 2.4, h = 1.3 and EC50 = 79 µM; for Kir6.2-R50G/SUR1-S1R, L = 1.7, h = 1.1 and EC50 = 75 µM.


