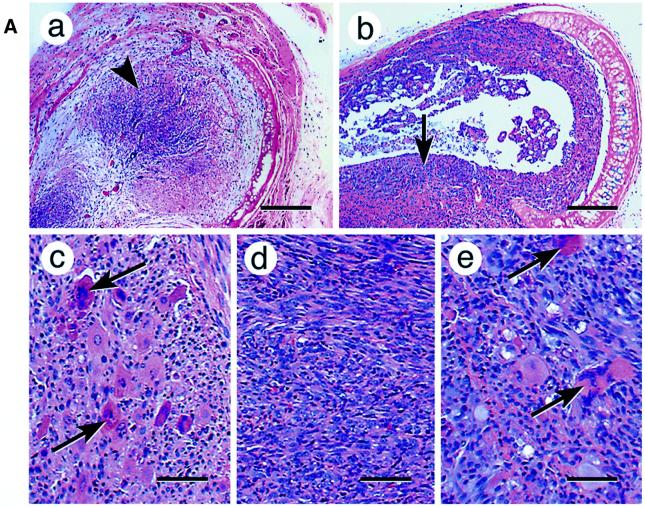
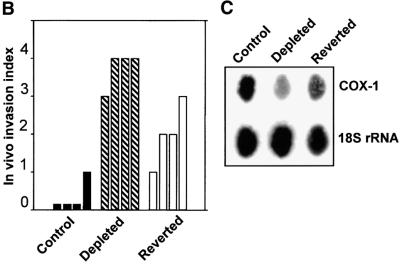
Fig. 3. Induced tumorigenicity of mtDNA-depleted C2C12 cells in vivo in Scid mice. (A) Hematoxylin–eosin stained sections of xenotransplants are shown. Control cells (a) that are growing inside the former tracheal lumen are shown by an arrowhead (invasion level 0). Panel b shows a representative in vivo growth pattern of mtDNA-depleted cells in a tracheal transplant. Note that the cells are growing inside the trachea as well as invading the external tracheal wall, as indicated by the arrow (invasion level 3–4). Panels c, d and e show the cellular differentiation pattern of control, mtDNA-depleted and reverted cells, respectively. The giant multinucleated rhabdomyoblasts (shown by arrows) are clearly seen in the control (c) and reverted cells (e). Such multinucleated cells are not seen in mtDNA-depleted cells (d). Bars in a and b represent 800 µm and those in c, d and e represent 100 µm. (B) The invasion levels of control, depleted and reverted cells from four different double blind assays are presented as bar diagrams. (C) Mitochondrial DNA contents of cells recovered from the representative sections of tracheal transplants as in (A). Total cell DNA (5 µg each) were subjected to Southern blot hybridization with mitochondrial-specific cytochrome oxidase I DNA probe. The blot was stripped and rehybridized with labeled probe for 18S rRNA probe to determine the loading level.

An official website of the United States government
Here's how you know
Official websites use .gov
A
.gov website belongs to an official
government organization in the United States.
Secure .gov websites use HTTPS
A lock (
) or https:// means you've safely
connected to the .gov website. Share sensitive
information only on official, secure websites.

