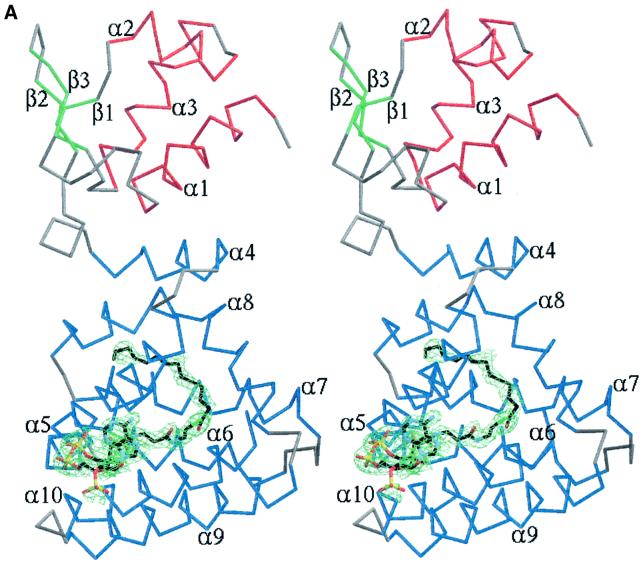
Fig. 3. (A) Stereo image of FadR–myristoyl-CoA structure and ligand electron density. A Cα trace is shown, coloured according to secondary structure. Helices are coloured red (DNA binding domain) or blue (acyl-CoA binding domain), strands green and turns grey. Secondary structure elements are labelled. The ligand, myristoyl-CoA, is shown as a stick model with carbons coloured black. A simulated annealing Fo – Fc map is also shown, contoured around the ligand at 2.25 σ (green). (B) Stereo image of protein–ligand interactions. The protein backbone is shown as a blue trace. Side chains touching the ligand (contact distance less than the sum of van der Waals radii + 0.5 Å) are shown as sticks coloured by atom type. Myristoyl-CoA is shown as a stick model with carbons coloured black. Water molecules interacting with the ligand are shown as green spheres. Hydrogen bonding with the ligand is indicated by black dashed lines.

An official website of the United States government
Here's how you know
Official websites use .gov
A
.gov website belongs to an official
government organization in the United States.
Secure .gov websites use HTTPS
A lock (
) or https:// means you've safely
connected to the .gov website. Share sensitive
information only on official, secure websites.

