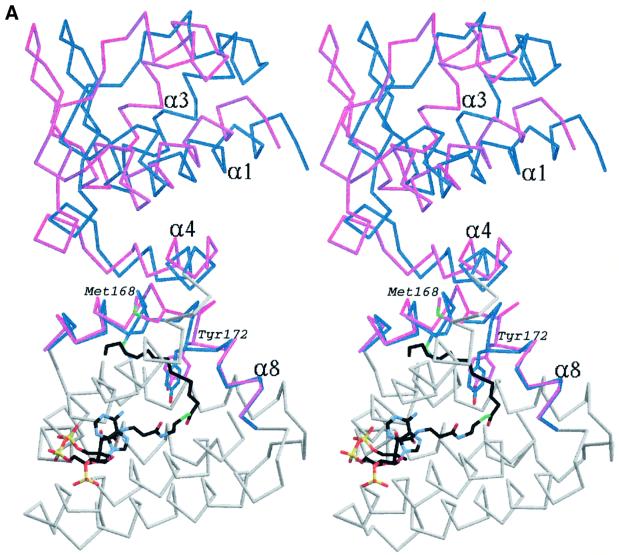
Fig. 4. (A) Stereo image of the superposition of a monomer from the apo-FadR structure onto the FadR–myristoyl-CoA complex. For areas showing relatively little conformational change, only the backbone trace of the monomer from the apo-FadR structure is shown in grey. Helices α4 and α8 in the acyl-CoA binding domain and the entire DNA binding domain are show in blue for apo-FadR, and in magenta for the FadR–myristoyl-CoA complex. Side chains of residues Met168 and Tyr172 are shown with blue carbons for apo-FadR and magenta carbons for the FadR–myristoyl-CoA complex. Myristoyl-CoA is shown as a stick model, with carbons coloured black. (B) Stereo image of the superposition of the FadR–operator complex onto the dimer of the FadR–myristoyl-CoA complex. The FadR–operator structure is coloured grey and FadR–myristoyl-CoA is coloured blue, with red DNA-recognition helices. Residues Met168 and Tyr172 are shown with carbons coloured orange (FadR–operator) or magenta (FadR–myristoyl-CoA). Myristoyl-CoA is shown as a stick model, with carbons coloured black. The DNA helix is shown as a thin black sticks model.

An official website of the United States government
Here's how you know
Official websites use .gov
A
.gov website belongs to an official
government organization in the United States.
Secure .gov websites use HTTPS
A lock (
) or https:// means you've safely
connected to the .gov website. Share sensitive
information only on official, secure websites.

