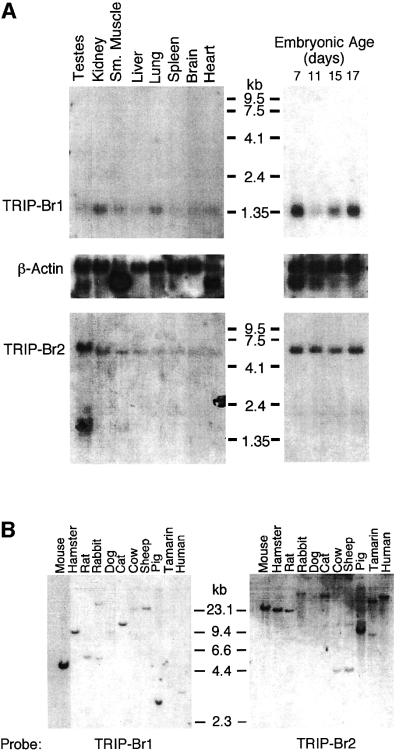
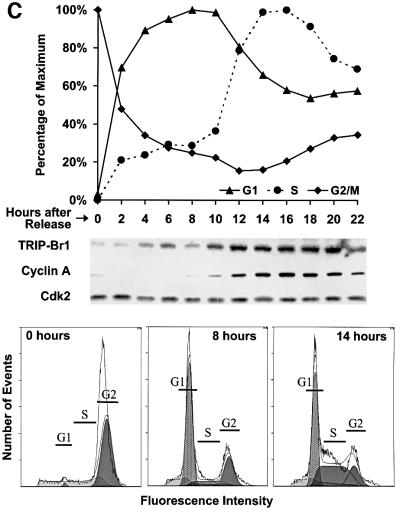
Fig. 4. TRIP-Br gene expression and evolutionary conservation. (A) Mouse multiple tissue and developmental northern blots were sequentially probed with an mTRIP-Br1 probe (entire 701-bp 16-1 insert containing 33 bp of 5′-UTR and encoding amino acids 1–222), an hTRIP-Br2 probe (419-bp insert encoding amino acids 1–136) and a β-actin probe. Each lane contains 2 µg of poly(A)+ RNA isolated from adult tissues or from whole fetuses on the indicated days of embryonic development. Size markers are indicated in kilobases. (B) A mammalian zoo blot of EcoRI-digested genomic DNA was sequentially probed with the same TRIP-Br1- and TRIP-Br2-specific probes as in (A). Each lane contains 25 µg of DNA from the indicated species. (C) hTRIP-Br1 protein expression and cell cycle distribution were monitored in U2OS cells (see Materials and methods) following release from nocodazole block. The fraction of cells in G1, S and G2/M phase are expressed as a percentage of the maximum. Histograms of FACS analysis at 0, 8 and 14 h are shown below.

An official website of the United States government
Here's how you know
Official websites use .gov
A
.gov website belongs to an official
government organization in the United States.
Secure .gov websites use HTTPS
A lock (
) or https:// means you've safely
connected to the .gov website. Share sensitive
information only on official, secure websites.

