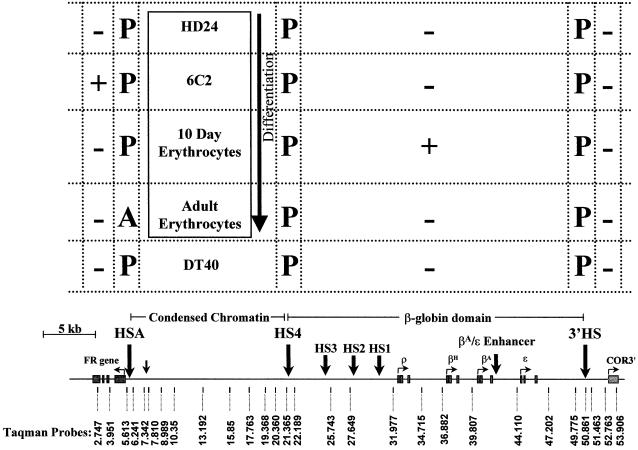
Fig. 1. Expression and chromatin structural changes in a 54 kb region containing the FR gene, β-globin gene and chicken olfactory receptor gene in cell lines derived from different erythropoietic stages and a non-erythroid cell. In the cells or cell lines listed, + or – indicates whether the gene in the map below is expressed or silent, respectively. P or A indicates the presence or absence of DNase I-hypersensitive sites. A scale map of the FR gene, condensed chromatin region, β-globin domain and chicken olfactory receptor gene is shown at the bottom. The locations of hypersensitive sites (HSA, HS4 and 3′HS) are indicated by large arrows. ‘Taqman probes’ denotes the name and location of primer pairs and Taqman probes used for analysis.

An official website of the United States government
Here's how you know
Official websites use .gov
A
.gov website belongs to an official
government organization in the United States.
Secure .gov websites use HTTPS
A lock (
) or https:// means you've safely
connected to the .gov website. Share sensitive
information only on official, secure websites.
