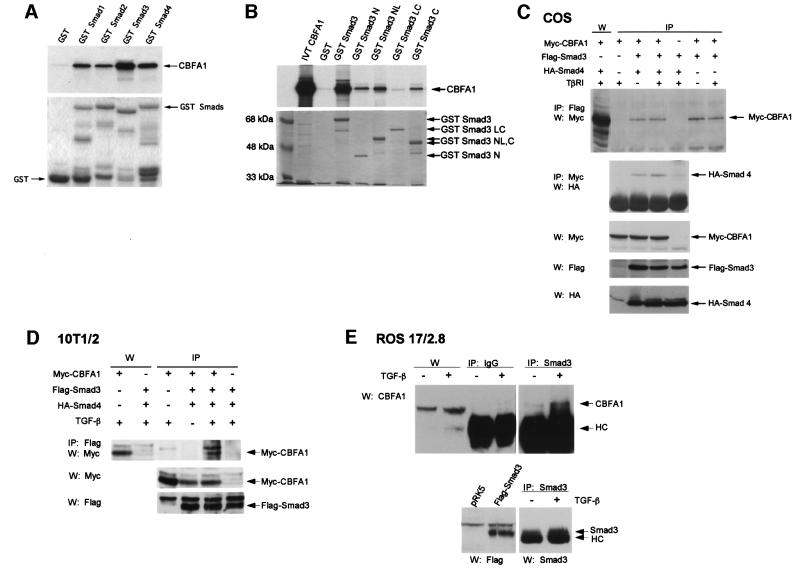
Fig. 7. CBFA1 interacts with Smad3. (A and B) Interaction of 35S-labeled, in vitro translated CBFA1 with GST–Smad fusion proteins, as shown. Interacting 35S-labeled CBFA1 (arrow) is visualized following gel electrophoresis and autoradiography. Five percent of the input reaction volume of 35S-labeled CBFA1 (IVT CBFA1) was loaded as control in lane 1 of (B). Below the autoradiograms are photographs of Coomassie Blue-stained gels to show the integrity and equal loading of the fusion proteins. (C) Interaction of Smad3 and Smad4 with CBFA1 in vivo, as assessed using co-immunoprecipitations. Cell lysates from transfected COS-1 cells expressing the indicated tagged proteins were used for immunoprecipitations (IP), followed by western blotting (W). The top panel shows the interaction of Myc-CBFA1 with Flag-Smad3, as assessed by immunoprecipitations with anti-Flag antibody-coupled Sepharose beads, followed by western blotting using anti-Myc antibody. The first lane visualizes Myc-tagged CBFA1 by western blotting without prior immunoprecipitation. The second panel shows interaction of HA-Smad4 with Myc-CBFA1, as assessed by immunoprecipitations with anti-Myc antibody, followed by western blotting using anti-HA antibody. The three lower panels show the relative expression levels of the tagged proteins in each lysate, as assessed by western blotting. (D) Interaction of Flag-Smad3 and Myc-CBFA1 in transfected 10T1/2 cells in the presence or absence of TGF-β (5 ng/ml), as assessed in (C). The first two lanes show the expression of Myc-tagged CBFA1, visualized by western blotting without prior immunoprecipitation. The two lower panels visualize the expression of Myc-CBFA1 and Flag-Smad3 by western analysis. (E) Interaction of endogenous CBFA1 and endogenous Smad3 in ROS 17/2.8 cells. This interaction was detectable by immunoprecipitation using a Smad3 antibody, followed by anti-CBFA1 western blotting, in TGF-β-treated (5 ng/ml), but not in untreated ROS 17/2.8 cell lysates. No CBFA1 was detected when rabbit anti-mouse IgG was used instead of anti-Smad3 antibody. The IgG heavy chain band is marked HC. CBFA1 levels in the lysates were detected by western analysis (left two lanes), whereas Smad3 levels were visualized by Smad3 immunoprecipitation followed by western analysis with a Smad3 antibody (lower panel, right two lanes), using Flag-Smad3 expressed in transfected 10T1/2 cells as reference (lower panel, left two lanes).

An official website of the United States government
Here's how you know
Official websites use .gov
A
.gov website belongs to an official
government organization in the United States.
Secure .gov websites use HTTPS
A lock (
) or https:// means you've safely
connected to the .gov website. Share sensitive
information only on official, secure websites.
