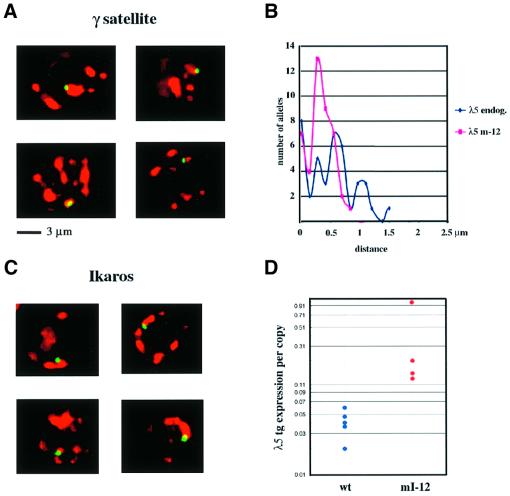
Fig. 4. Nuclear localization and expression of the pericentromeric transgene. (A) Three-dimensional FISH analysis of the location of the λ5 transgene relative to pericentromeric heterochromatin clusters in nuclei of activated B cells from line mI-12. Each panel shows a single optical section of a nucleus obtained by deconvolution microscopy. The probes used for the λ5 transgene (green) and for the γ-satellite repeats (red) were the same as in Figure 3. (B) Distance of the λ5 transgene from the nearest centromeric cluster in activated B cells from line mI-12 (red line) compared with the distance for the endogenous λ5 gene (blue line) in non-transgenic activated B cells. The distance was determined by rotating 3D images of nuclei generated by deconvolution microscopy and measuring the distance from the centre of the gene signal to the edge of the nearest cluster. The distances are shown on the x-axis, while the y-axis gives the number of alleles located at each distance. The probe used to detect the endogenous λ5 gene was the cosmid λ5 3.1 (Sabbattini et al., 1999). Forty-four alleles were analysed for the transgene and 40 for the endogenous λ5 gene. (C) Immuno-FISH analysis of the location of the λ5 transgene relative to Ikaros clusters in nuclei of activated B cells from line mI-12 (see Materials and methods). Each panel shows a single optical section of a nucleus. The λ5 transgene (green) was detected using the DNA probe described in Figure 3. The Ikaros clusters (red) were visualized using antibodies against the N- and C-terminal domains of Ikaros (Hahm et al., 1994). (D) Levels of expression of the λ5 transgene in activated B cells from four mice from the pericentromeric line mI-12 (red) compared with expression in three mice from wt-5 and two from wt-6 (blue). Expression of the λ5 transgene is normalized to the level of the endogenous β-actin transcript used as a loading control. The expression per copy of the mutant and wild-type transgenes is displayed using an arbitrary scale in which the highest level of expression was assigned a value of 1.0. The values are shown on a logarithmic scale to illustrate the variation in expression within the two groups of animals. The difference between expression in the wild-type lines and that observed for line mI-12 is significant (Mann–Whitney U test, P <0.02).

An official website of the United States government
Here's how you know
Official websites use .gov
A
.gov website belongs to an official
government organization in the United States.
Secure .gov websites use HTTPS
A lock (
) or https:// means you've safely
connected to the .gov website. Share sensitive
information only on official, secure websites.
