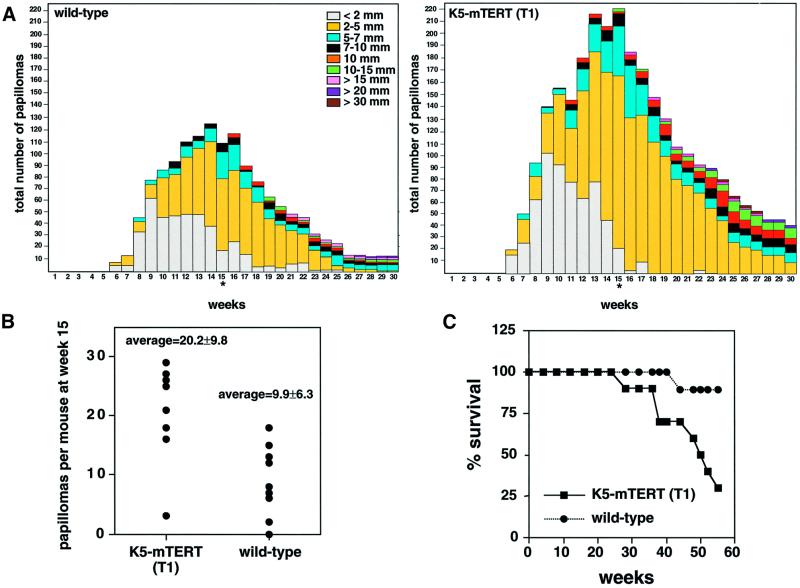
Fig. 4. (A) The total numbers of papillomas are plotted versus the number of weeks after the start of carcinogen treatment. Termination of TPA treatment (week 15) is indicated by an asterisk. (B) Average number of papillomas per mouse at week 15 after the start of carcinogen treatment. Wild-type and K5-mTERT (T1) transgenics showed an average of 9.9 ± 6.3 and 20.0 ± 9.8 papillomas per mouse, respectively. (C) Survival of DMBA + TPA-treated wild-type and K5-mTERT (T1) mice during the multistage chemical carcinogenesis experiment.

An official website of the United States government
Here's how you know
Official websites use .gov
A
.gov website belongs to an official
government organization in the United States.
Secure .gov websites use HTTPS
A lock (
) or https:// means you've safely
connected to the .gov website. Share sensitive
information only on official, secure websites.
