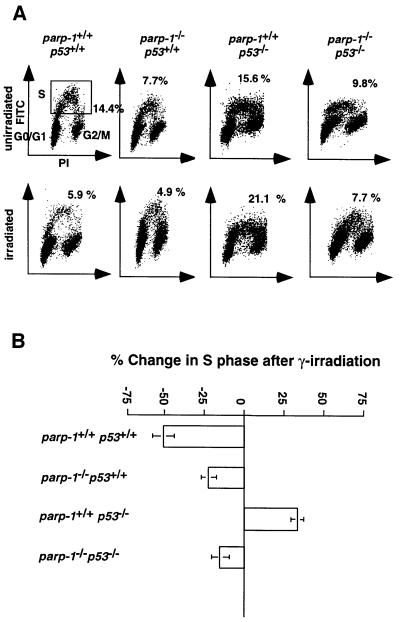
Fig. 4. (A) Representative flow cytometry scatter plots of MEFs nuclei 18 h after irradiation (5 Gy), plotted as increasing fluorescence of propidium iodide (PI; x-axis) versus increasing FITC fluorescence obtained with an anti-BrdU–FITC-conjugated antibody (y-axis). Gating for S-phase cells is shown in the panel from unirradiated wild-type mice (upper left). (B) Graph representing the mean ± SD change in the percentage of S-phase cells after irradiation (n = 3–6).

An official website of the United States government
Here's how you know
Official websites use .gov
A
.gov website belongs to an official
government organization in the United States.
Secure .gov websites use HTTPS
A lock (
) or https:// means you've safely
connected to the .gov website. Share sensitive
information only on official, secure websites.
