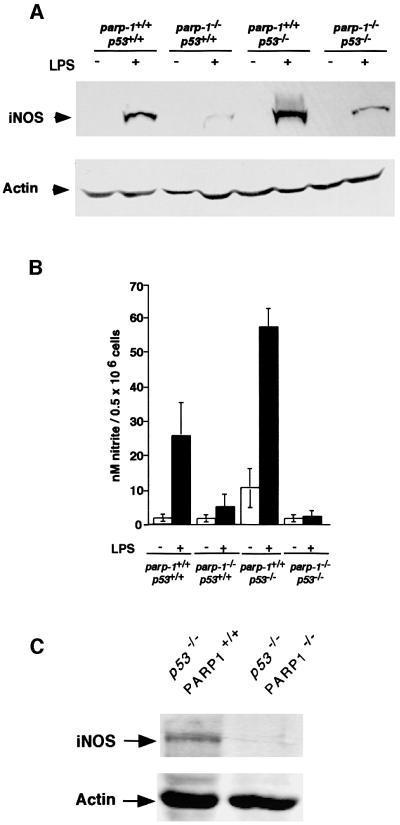
Fig. 6. (A) Western blot analysis of iNOS expression in crude extracts of peritoneal macrophages from mice of the genotypes indicated, 18 h after LPS treatment. Expression of actin is shown as a loading control. (B) Nitrite release in primary cultured murine macrophages from mice of the indicated genotype treated or not with 5 µg/ml LPS for 24 h. Each value represents the mean ± SD of three independent experiments. (C) iNOS expression in crude extracts of splenocytes derived from parp-1+/+p53–/– and parp-1–/–p53–/– mice.

An official website of the United States government
Here's how you know
Official websites use .gov
A
.gov website belongs to an official
government organization in the United States.
Secure .gov websites use HTTPS
A lock (
) or https:// means you've safely
connected to the .gov website. Share sensitive
information only on official, secure websites.
