
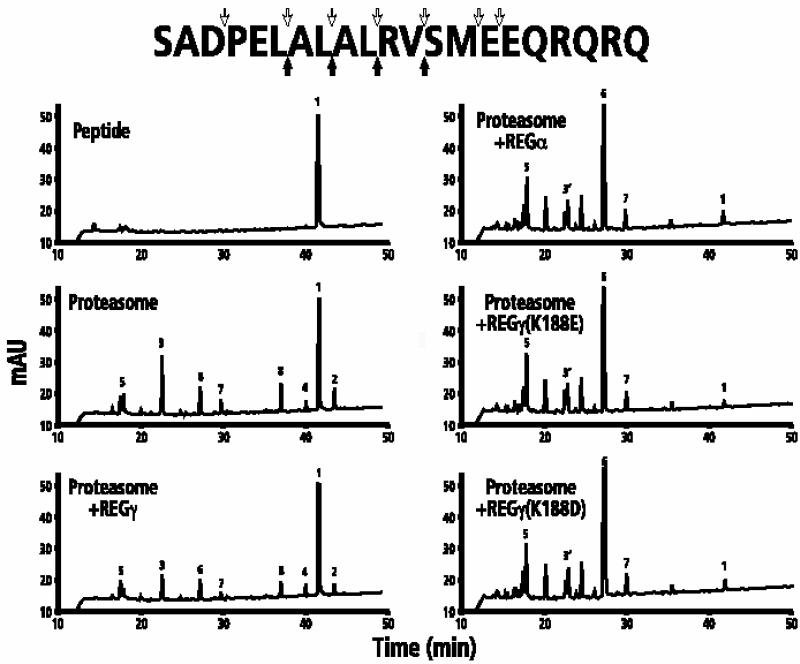
Fig. 4. HPLC/MS analysis of proteasomal cleavage products from P21. The upper left panel shows the HPLC profile of undigested P21; the remaining panels show the HPLC profiles of cleavage products generated after 12 h at 37°C by 600 ng of proteasome in the absence or presence of REGγ, REGα, REGγ (K188E) or REGγ (K188D). Major cleavage products were identified by MS as described in Materials and methods. Peak 1: the P21 substrate, SADPELALALRVSMEEQRQRQ; peak 2: SADPELALAL; peak 3: RVSMEEQRQRQ; peak 4: SADPELAL; peak 5: SMEEQRQRQ; peak 6: SADPEL; peak 7: ALRV; peak 8: ALAL; peak 3′: RVSM and RVSME. The undesignated peaks are those products whose sequence could not be unambiguously determined. The filled arrows beneath the P21 sequence reflect the primary cleavage sites by proteasome in the absence or presence of REGγ. The downward pointing open arrows are products generated in the presence of REGα or REGγ (K188E/D).