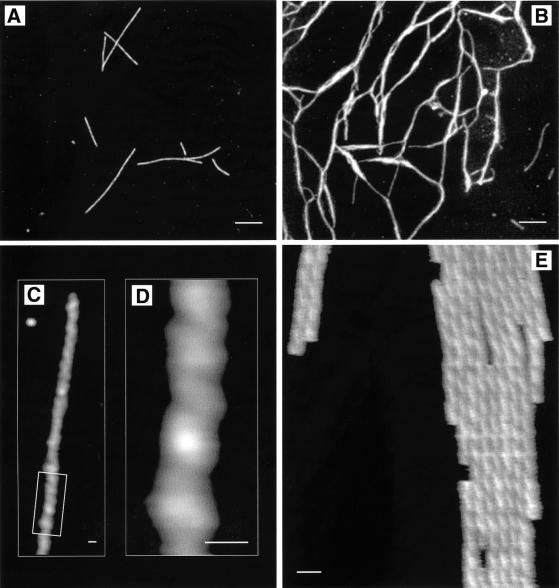
Fig. 1. Morphological characterization of lithostathine protofibrils by tapping mode AFM in air (A–D) and in solution (E). The S1 form of lithostathine polymerizes into protofibrils (A) that can form networks (B). Topography was coded from black to white corresponding to 0 and 4.5 nm full scale in (A), and 0–6.9 nm in (B). (C) Image of an individual protofibril, recorded at higher magnification. (D) Zooming in on the protofibril (box in C) shows an axial periodicity along the structure with an apparent spacing of ∼20 nm. (E) Imaging under solution made it possible to observe the helicoidal structure of lithostathine protofibrils with greater accuracy (mean peak-to-peak distance along the axial repeat: 17.1 ± 1.9 nm), and to measure their heights in a fully hydrated state (7.7 nm). Topography was coded from black to white corresponding to 0 and 10 nm full scale. Tapping frequency was set between 200 and 300 kHz in air and 8 and 10 kHz in solution. Images were recorded at scan rates of between 1 and 3 Hz per line. Scale bars represent 400 nm in (A) and (B), and 20 nm in (C)–(E).

An official website of the United States government
Here's how you know
Official websites use .gov
A
.gov website belongs to an official
government organization in the United States.
Secure .gov websites use HTTPS
A lock (
) or https:// means you've safely
connected to the .gov website. Share sensitive
information only on official, secure websites.
